Gold attracts some sellers after modest recovery in USD.
US Dollar edged higher against its major peers from its October's low, exerting pressure on the yellow metal. Fed policymakers collectively decided to maintain the key interest rate at 4.50% as they closely monitor the possible repercussions of Trump's inflationary policies in the near future. Even though it is widely expected for the Fed to deliver two quarter point rate cuts this year, the central bank seems to be in no rush to do it anytime soon. However, geopolitical tensions elevating in the Middle East and between Russia and Ukraine keep the investors on the edge of their seats.
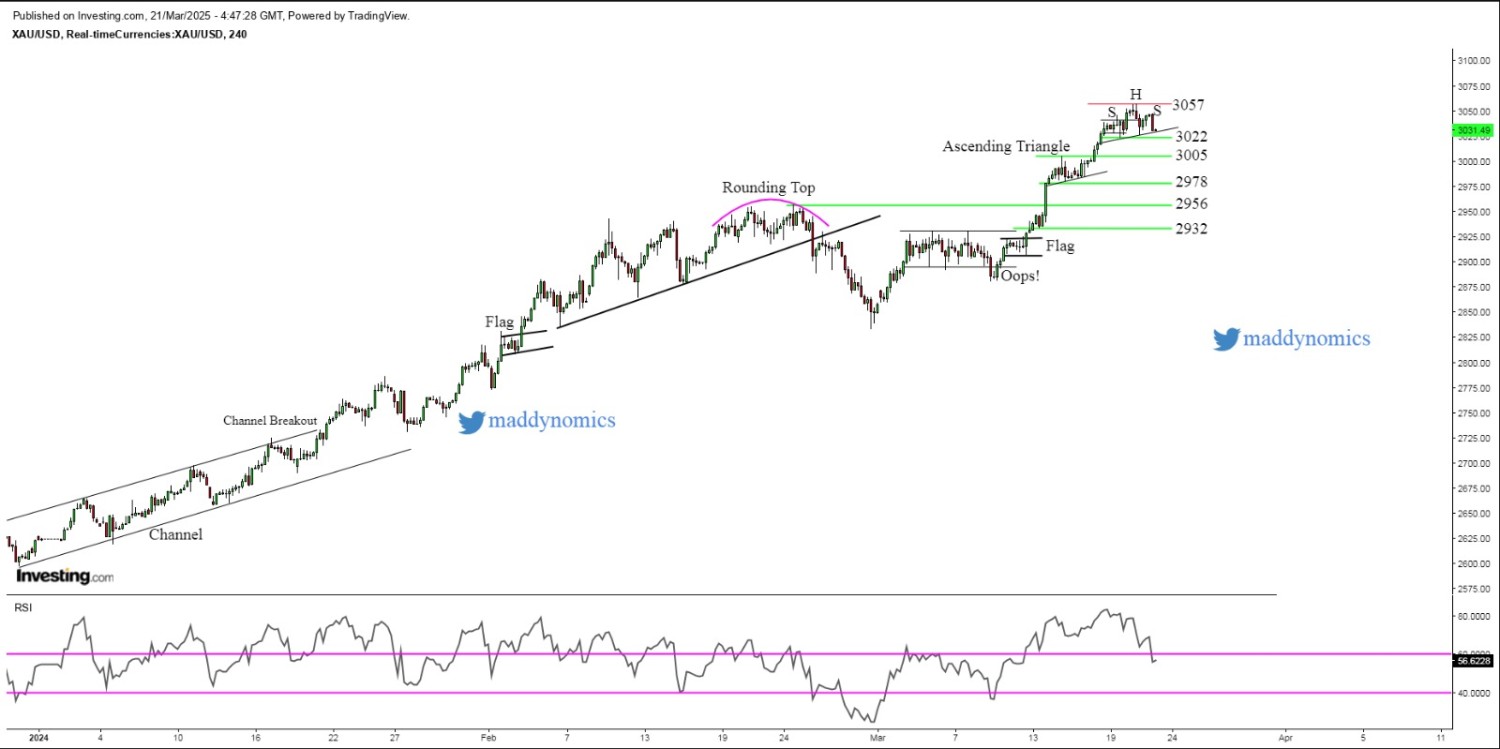
From technical perspective, a Head and Shoulder pattern formed on the 4H chart of gold hints that some profit booking might take place and prices are poised for further decline towards $3000 once they breach the neckline at around $3022-$3023.
On the upside, prices may face resistance at $3055-$3057 peak which was attained on Thursday. Sustaining above that level, Gold is set for new record highs.
Gold Structure: Doji on Daily, H&S on 4hr, Bear Flag on 15mins.
Intraday Strategy/ Intraday Trend: Sell on Rise, Sell on Break of Supports/ Bearish
Weekly Trend: Bullish
Major Resistance: 3035, 3046, 3057
Major Support: 3025, 3018, 3005
Recent News
NASDAQ Builds Bullish Momentum, Poised f...
October 15, 2025
Market Insights
Stronger Dollar weighs on Gold amid Fed...
July 17, 2025
Market Insights
Gold surges past $3,800 amid rising US G...
September 29, 2025
Market Insights
US TECH 100 IN CRUCIAL WEDGE FORMATION B...
June 17, 2025
Market Insights
Oil Prices Climb for Second Day Amid Fre...
February 25, 2025
Market Insights
Gold struggles near daily low after posi...
July 07, 2025
Market Insights
