Gold slips below $3,340 as strong US data dims Fed rate cut hopes
Gold regained footing above $3,300 after dipping early in the week, as bears were struggling to maintain control amid cautious market sentiment driven by U.S. tariff uncertainty. Technical signals also suggest bulls are stepping in around key levels, reflecting hesitation among sellers .
Looking ahead, upcoming U.S. inflation data and trade policy developments—especially evolving tariff headlines—are expected to shape gold’s direction in the near term. While tighter Fed rate-cut expectations and a firmer dollar could cap gains, renewed safe-haven demand from trade tensions might support further upside if risk sentiment weakens.
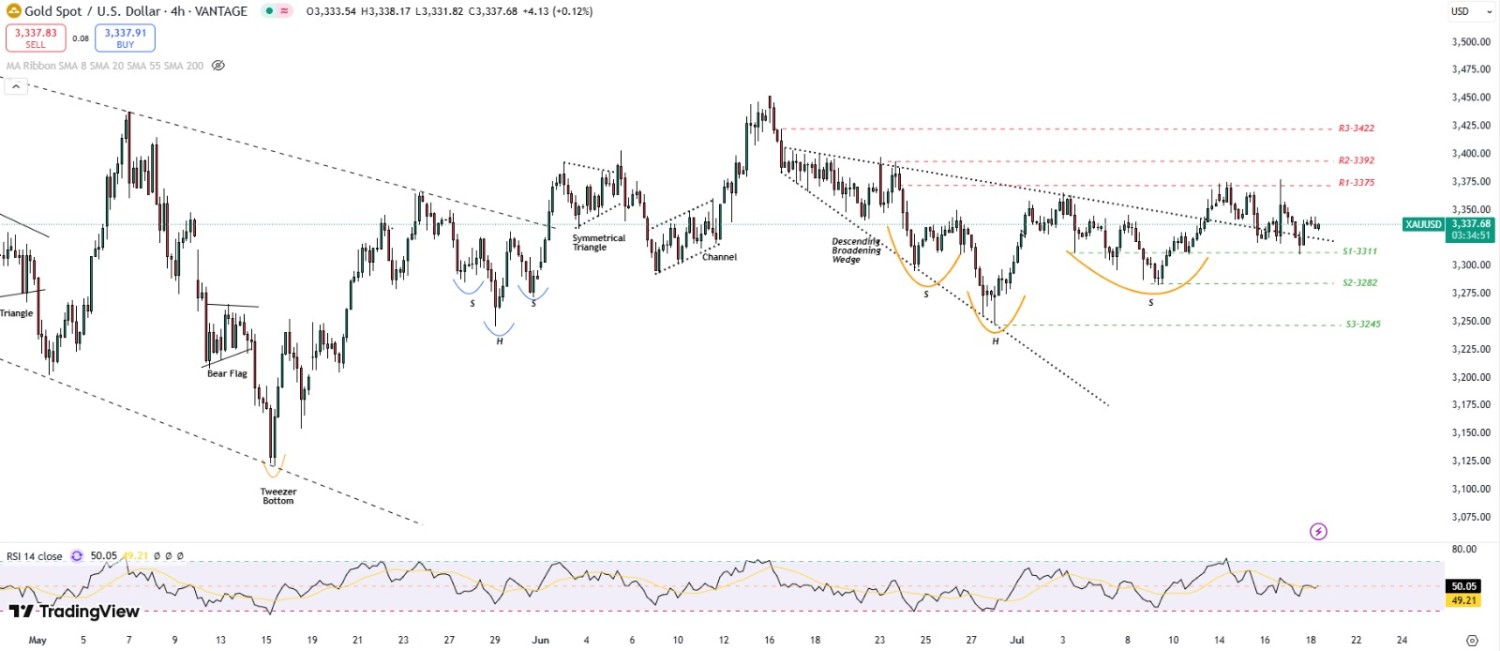
XAU/USD TECHNICAL OVERVIEW
Technical Structure: Gold remains in a neutral weekly trend, showing signa of indecision as technical structures reveal mixed signals. On the daily chart, a Hanging Man pattern has emerged near the 20-SMA, suggesting potential weakness if follow-through selling occurs. The 4-hour chart displays a Doji, reflecting market hesitation, while the 1-hour timeframe shows a Bearish Flag, indicating the possibility of a continuation to the downside.
Weekly Trend: Neutral
Intraday Trend/ Intraday Strategy: The intraday bias remains Bearish to Neutral and favours the strategy of Selling on Resistance and Selling on Support Breakdown.
Major Support: 3330, 3311, 3295
Major Resistance: 3345,
Recent News

EUR/USD stays pressured toward 1.0800 am...
March 21, 2025
Market Insights
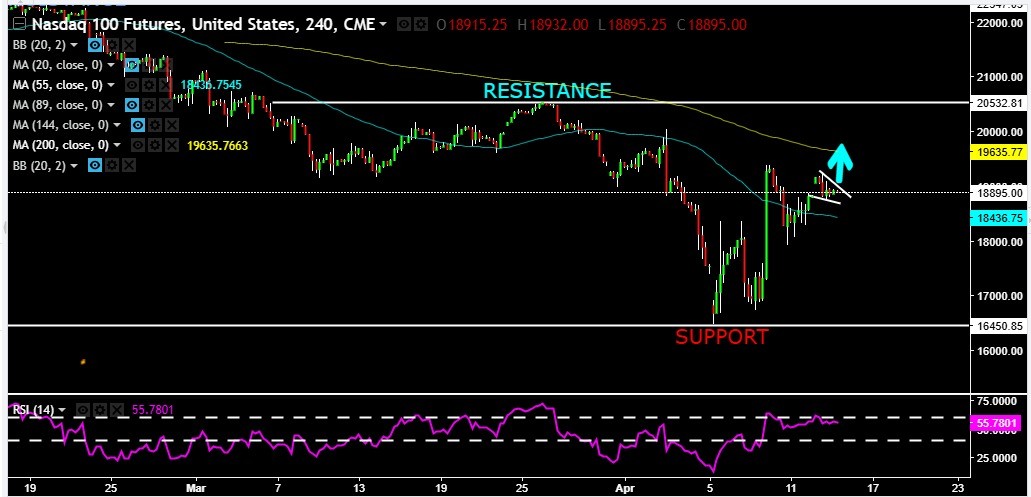
Nasdaq 100 Futures Eye Bullish Surge Cri...
April 15, 2025
Market Insights
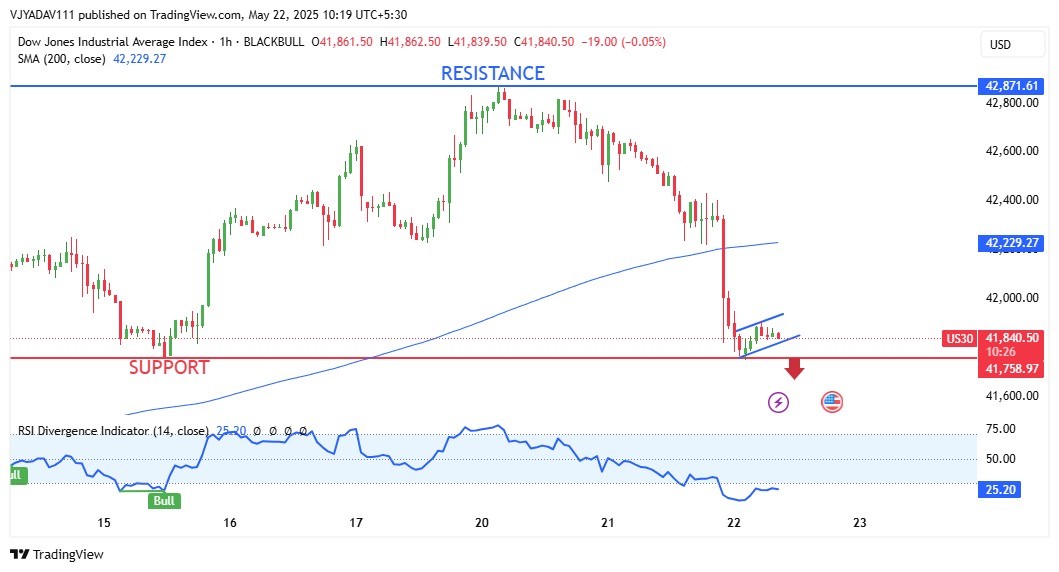
Dow Jones at Critical Support Bearish Pr...
May 22, 2025
Market Insights
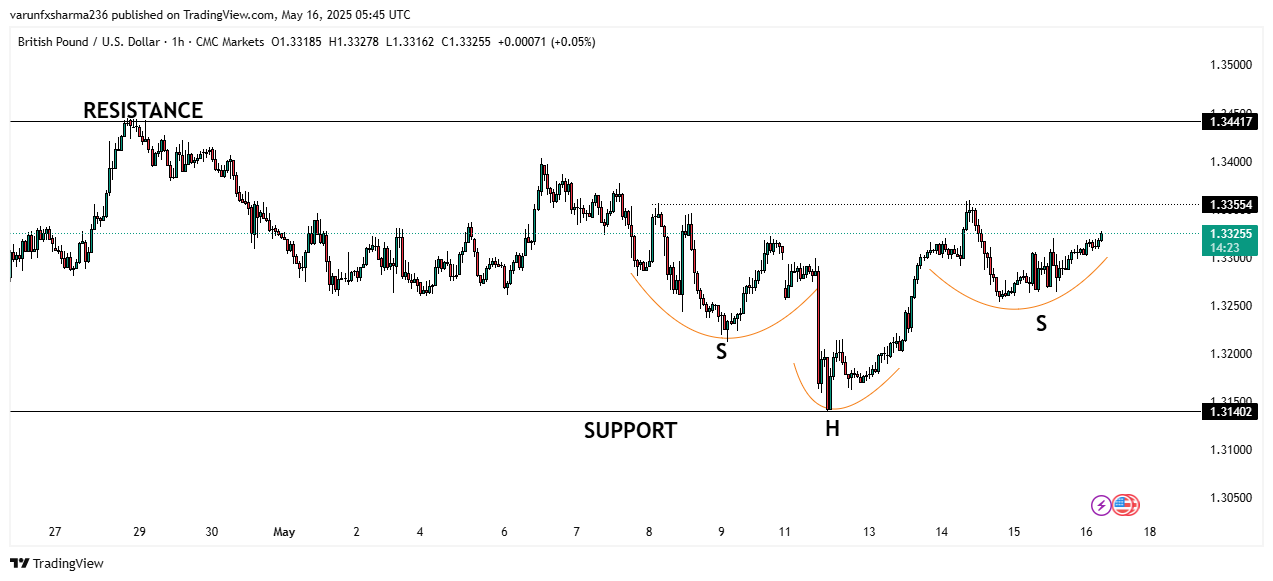
GBP/USD Eyes Bullish Breakout Amid Softe...
May 16, 2025
Market Insights
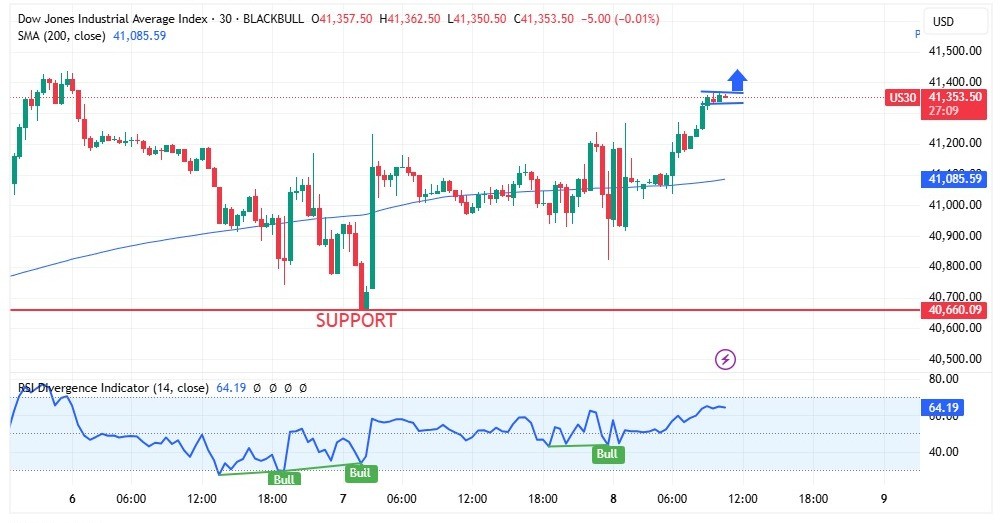
DOW JONES making a Bullish Flag on 1HR t...
May 08, 2025
Market Insights
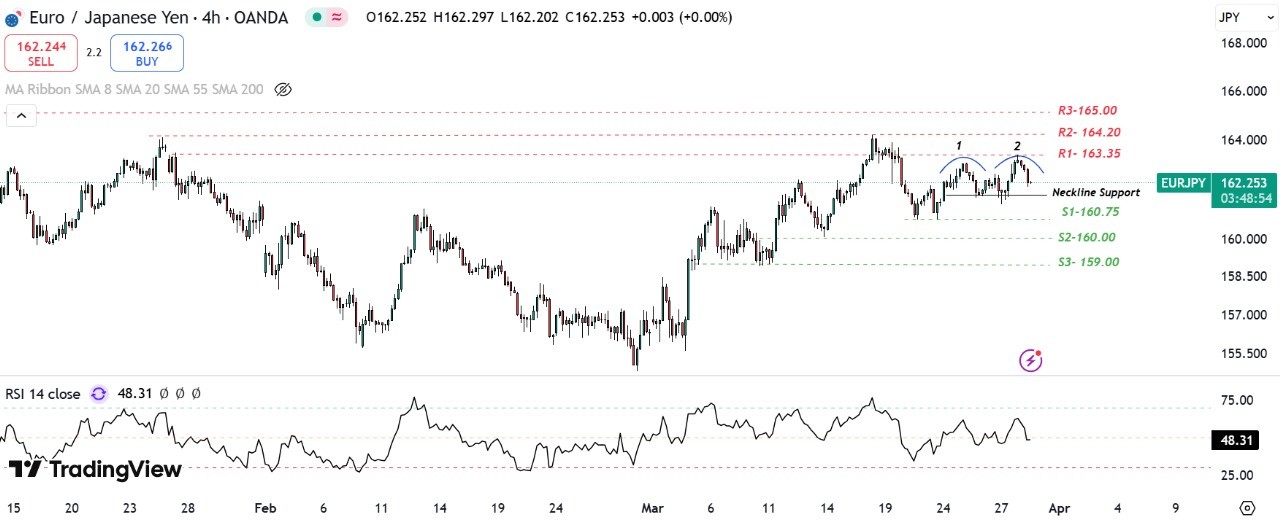
EUR/JPY: Japanese Yen picks up strength...
March 28, 2025
Market Insights


