US Tech 100 Chart Breakout Pattern Emerging Between Support and Resistance
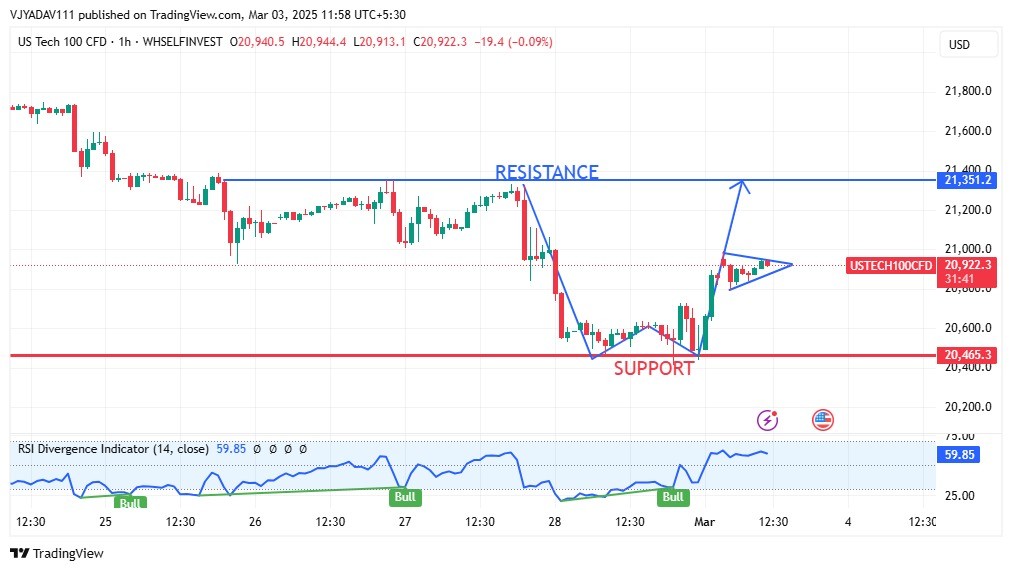
NASDAQ was up on Monday morning after testing the low level of 20458 in the last trading session as Investors are keenly eyeing the March 4 deadline for President Donald Trump’s proposed tariffs on key US trading partners.
Recent News
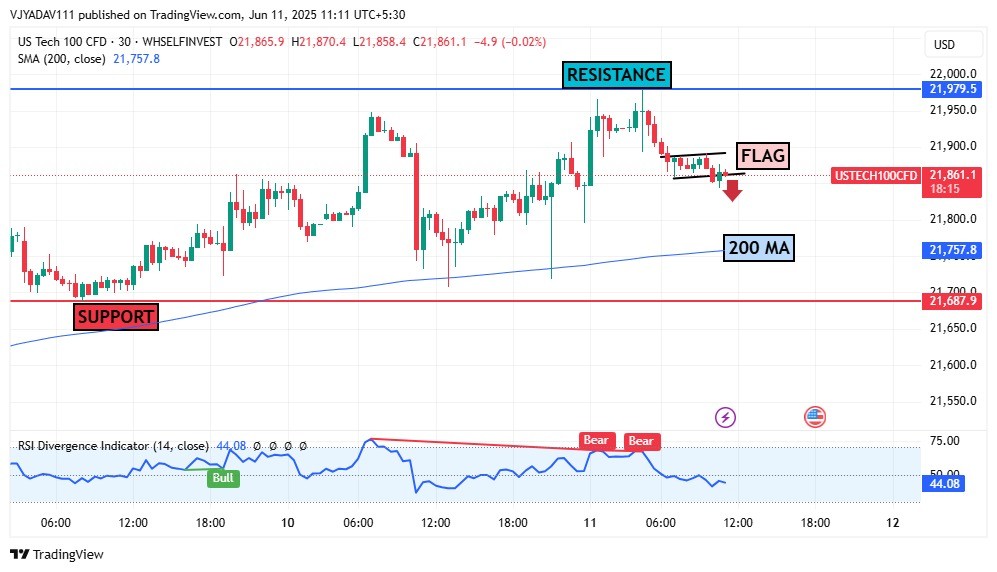
US Tech 100 Bearish Flag Near Resistance...
June 11, 2025
Market Insights
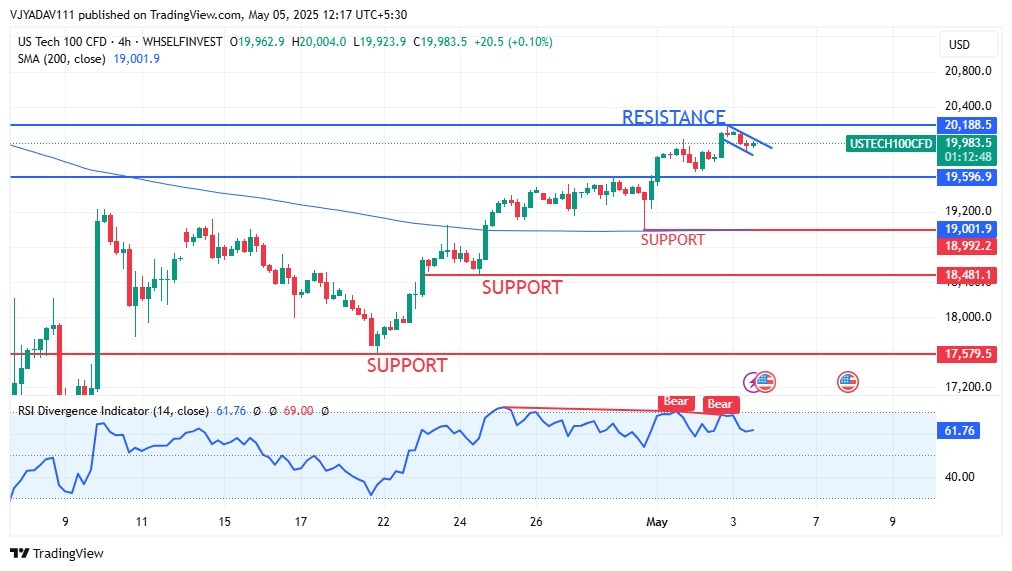
US Tech 100 Surges Towards Key Resistanc...
May 05, 2025
Market Insights
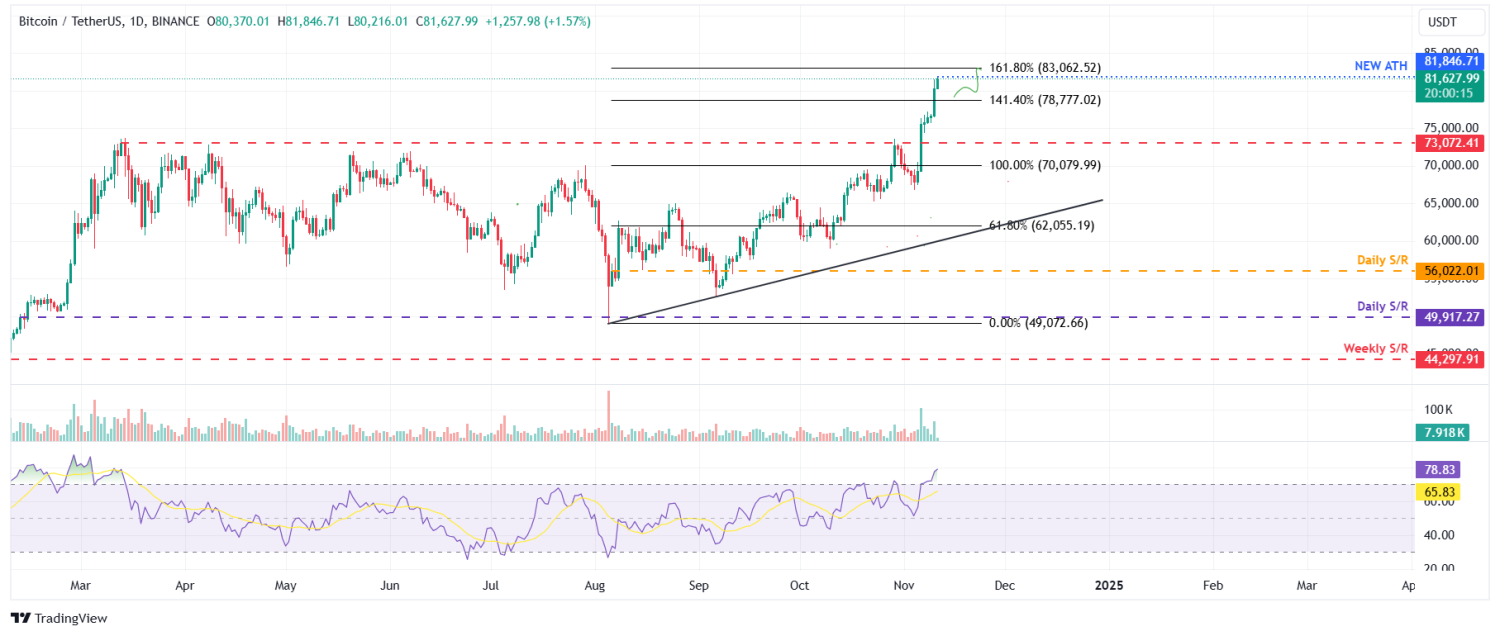
Bitcoin Bulls Target $83,000 Milestone A...
November 11, 2024
Market Insights
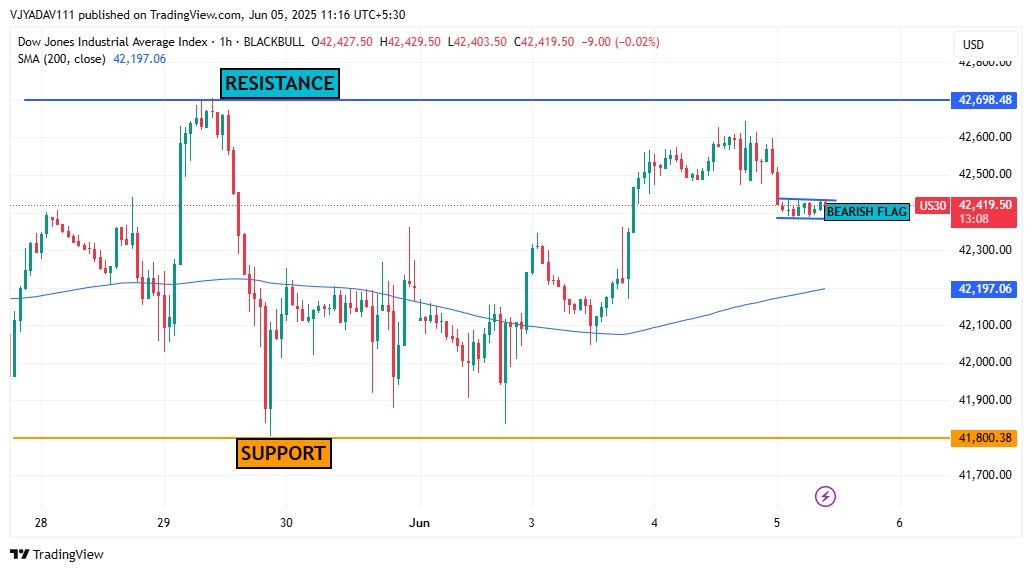
US30 Signals Bearish Flag Pattern Critic...
June 05, 2025
Market Insights
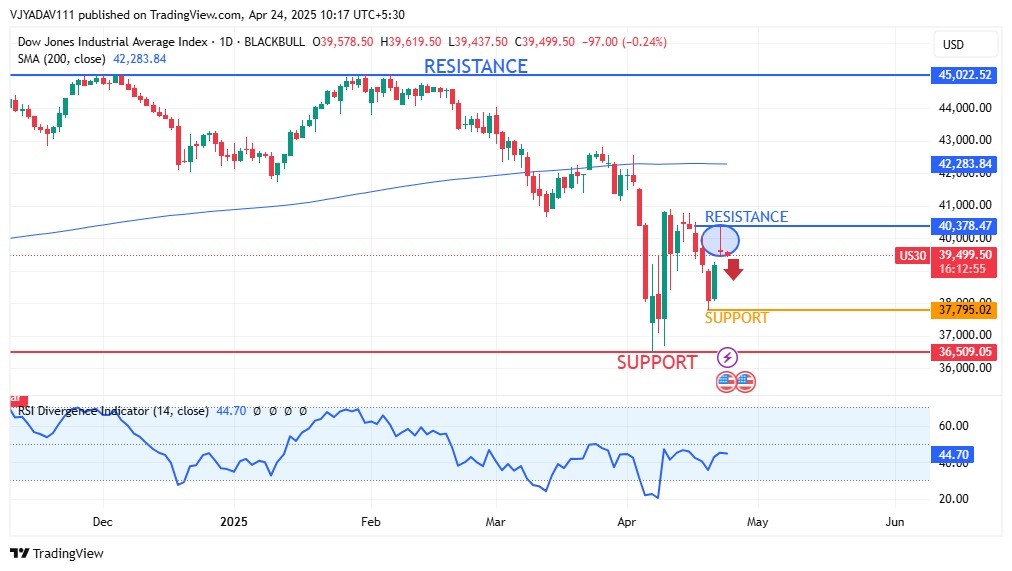
Dow Jones at a Crossroads Resistance Hol...
April 24, 2025
Market Insights
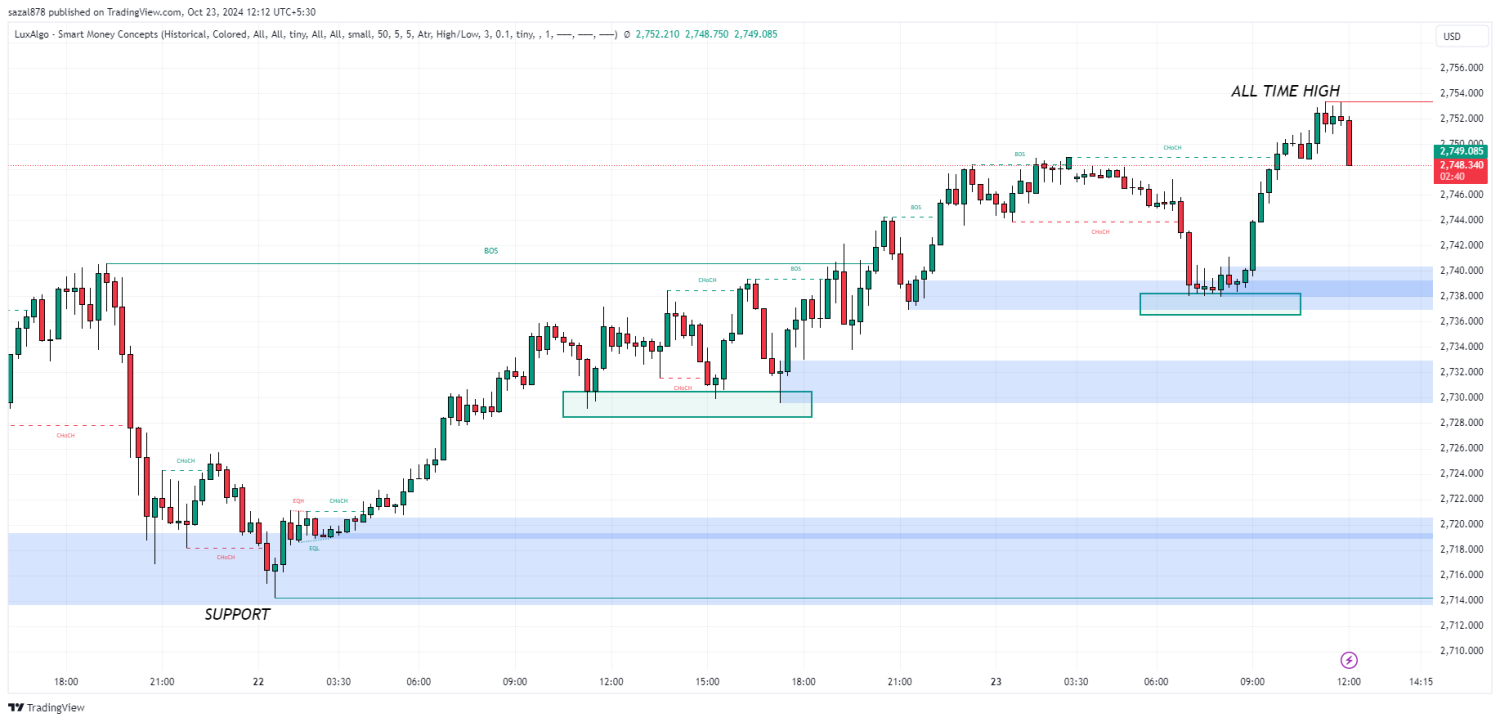
GOLD RALLY 2750!!! WHAT IS NEXT?
October 23, 2024
Market Insights


