Gold blazes past one week high ahead of FOMC meet
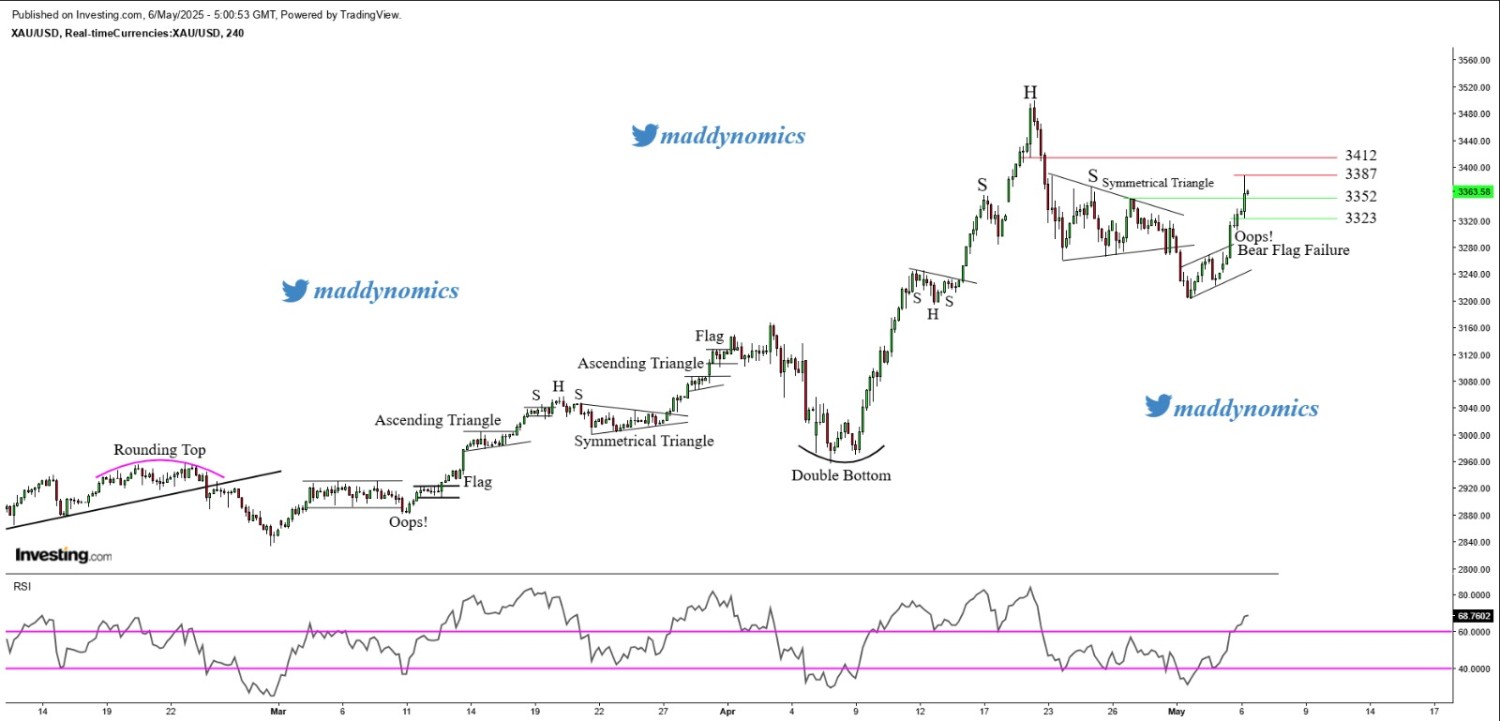
Gold witnessed a sudden uptick in the prices in Monday's session and continues to trade with a positive bias for the second straight day after climbing to a one week high of $3386 during the Asian session. Support for the yellow metal stems from safe-haven demand driven by geopolitical instability unfolding between Israel and Houthi rebels in Yemen.
Additionally, the US Dollar remains under pressure as market participants react to ongoing economic uncertainty triggered by President Trump’s tariff policies. The lack of strong USD buying interest adds further underlying strength to gold.
However, despite these supportive factors, investors are cautious ahead of the Federal Reserve’s policy meeting starting today. This has led to subdued momentum in gold, with traders avoiding aggressive positions until there is more clarity from the FOMC regarding future monetary policy. As a result, while the overall trend remains positive, near-term price action may remain range-bound.
XAU/USD TECHNICAL OVERVIEW
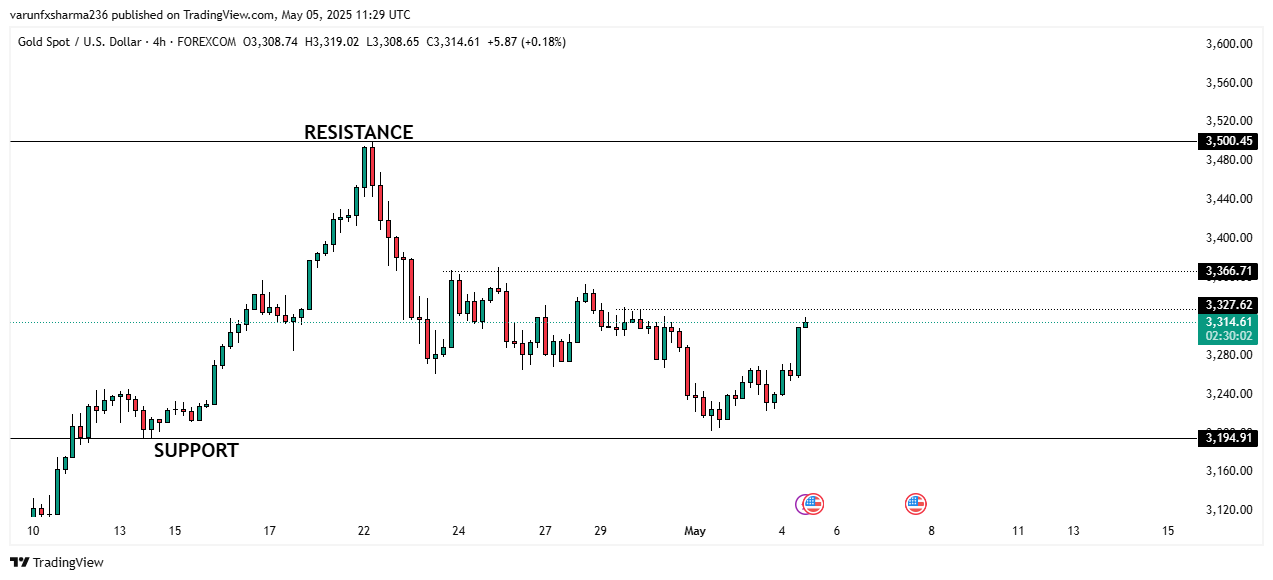
Technical Structure: Gold has confirmed a breakout from a Doji candlestick pattern on the daily timeframe, indicating a continuation of bullish momentum after a brief indecisive phase. A consolidation breakout is visible on the 4-hour timeframe, further reinforcing the bullish sentiment. Currently, gold is consolidating on the 1-hour chart, suggesting a momentum build up before another leg higher. Traders should watch closely for a breakout or a pullback to support.
Intraday Trend/ Intraday Strategy: The intraday trend remains bullish and favours an approach of buying on dips near key support levels and buying breakouts from intraday consolidation.
Weekly Trend: Bullish
Key Resistance Levels: 3372, 3380, 3388
-
Key Support Levels: 3353, 3338, 3330
Recent News
Dow Jones Trades Near Key Support as Bea...
March 13, 2025
Market Insights
US TECH 100 IN CRUCIAL WEDGE FORMATION B...
June 17, 2025
Market Insights
Gold (XAUUSD) Consolidating Above $3,612...
September 15, 2025
Market Insights
Gold lose ground in early US Session, No...
October 23, 2024
Market Insights
Gold Price Steady Near Daily High as Saf...
May 05, 2025
Market Insights
US30 (Dow Jones) Trading Within Ascendin...
July 29, 2025
Market Insights
