Natural Gas 4 Hour Chart Pinpointing the Wedge Breakout with Key Support and Resistance Levels
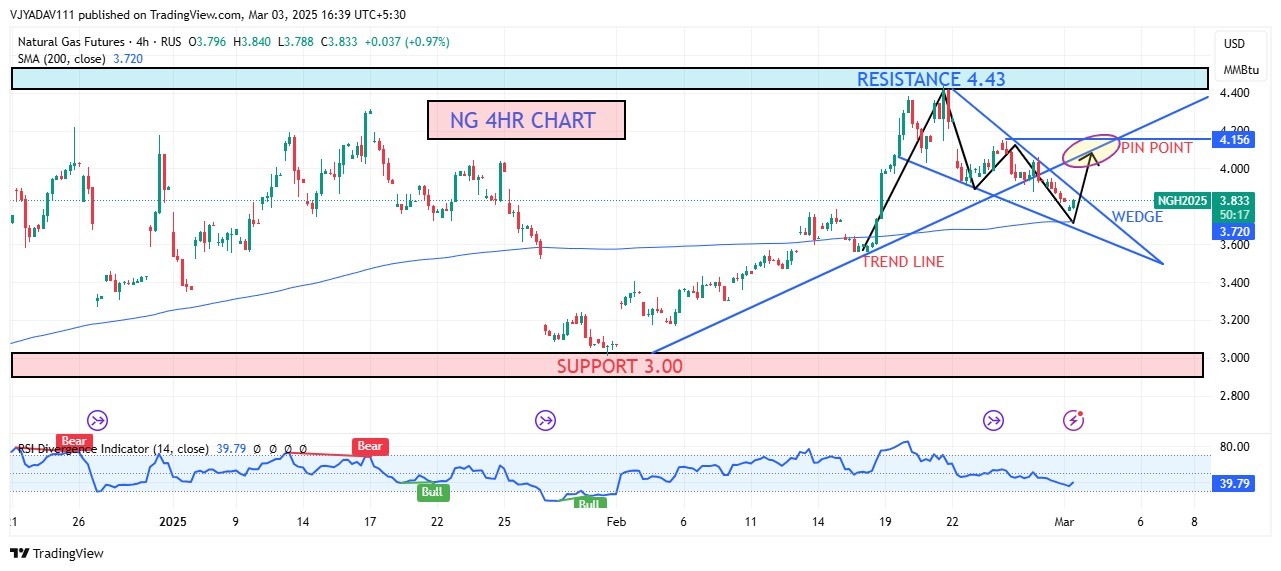
NATURAL GAS (NG) was down on Monday morning after testing the high level of $ 4.43 in the last weekly trading session as US utilities withdrew 261 billion cubic feet (bcf) of natural gas from storage in the week ending February 21, 2025, reducing total inventories to 1,840 bcf. The withdrawal was nearly in line with market expectations of 256 bcf.
Recent News

Gold Holds $3,375 – Ascending Triangle &...
August 23, 2025
Market Insights
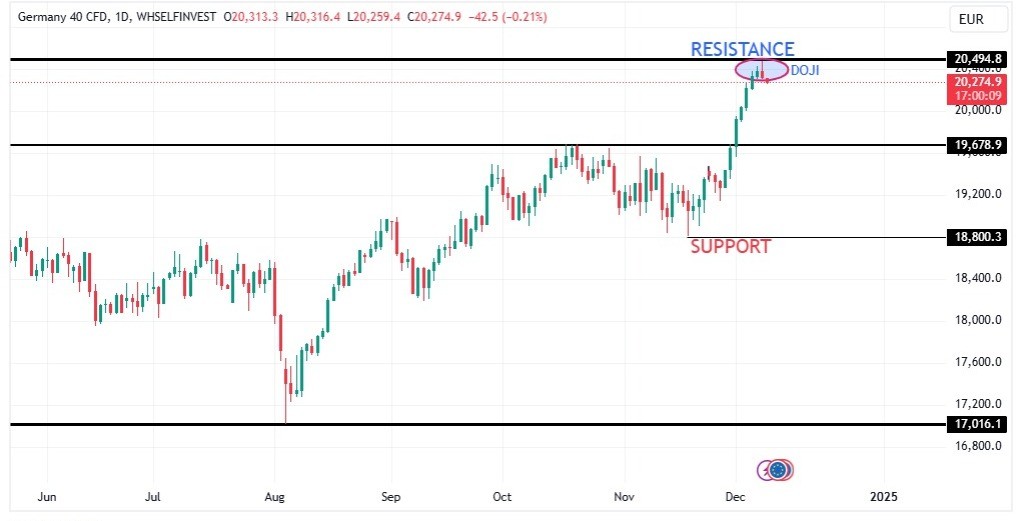
DAX made a Doji on Daily time frame
December 10, 2024
Market Insights
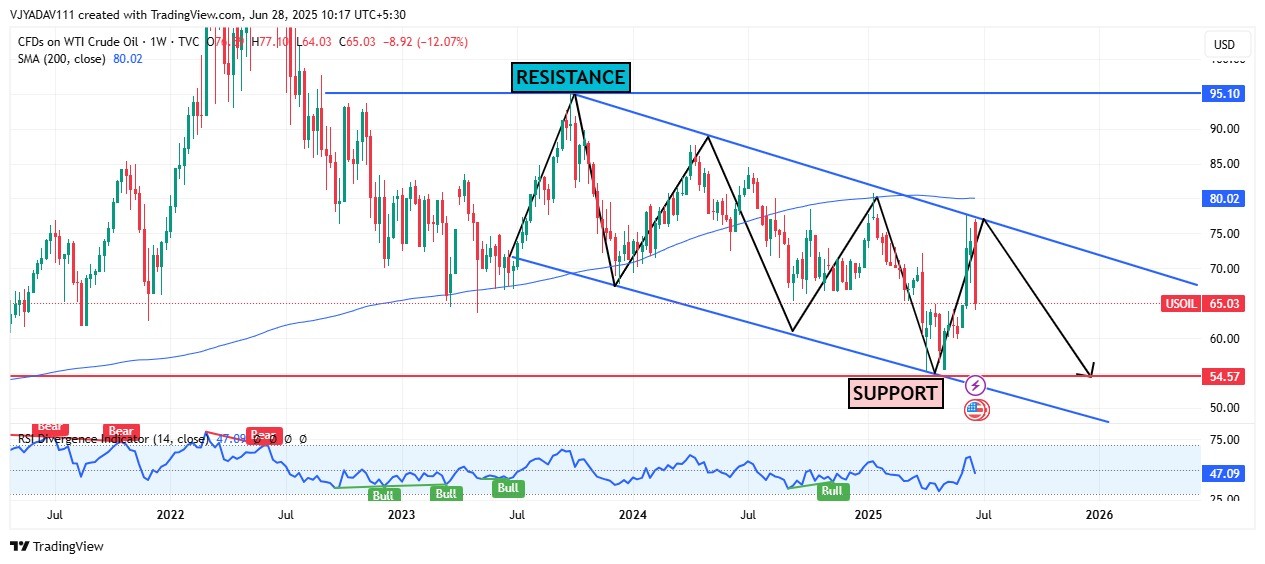
WTI Crude Oil Bearish Channel Signals Po...
June 28, 2025
Market Insights
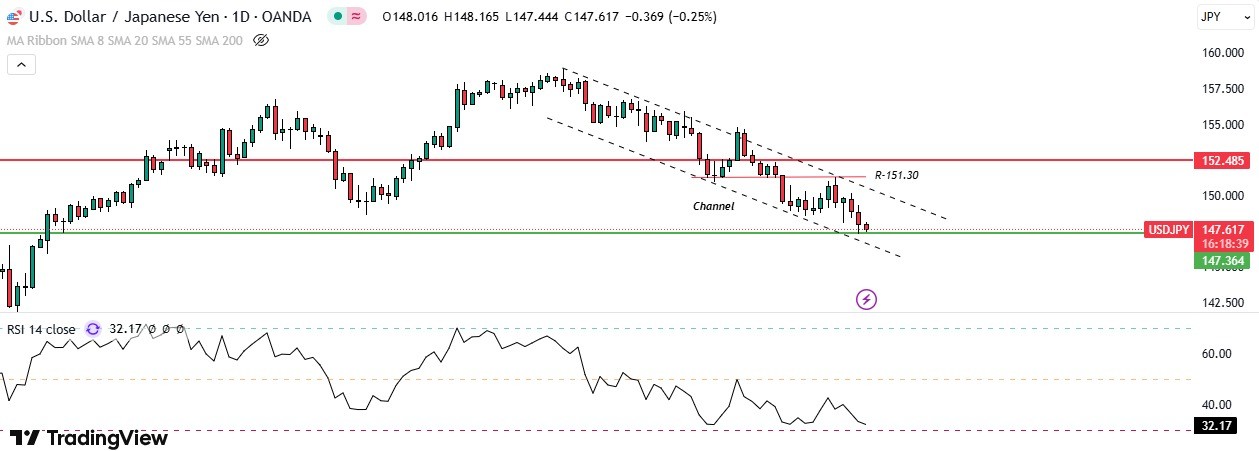
Japanese Yen remains resilient against t...
March 07, 2025
Market Insights
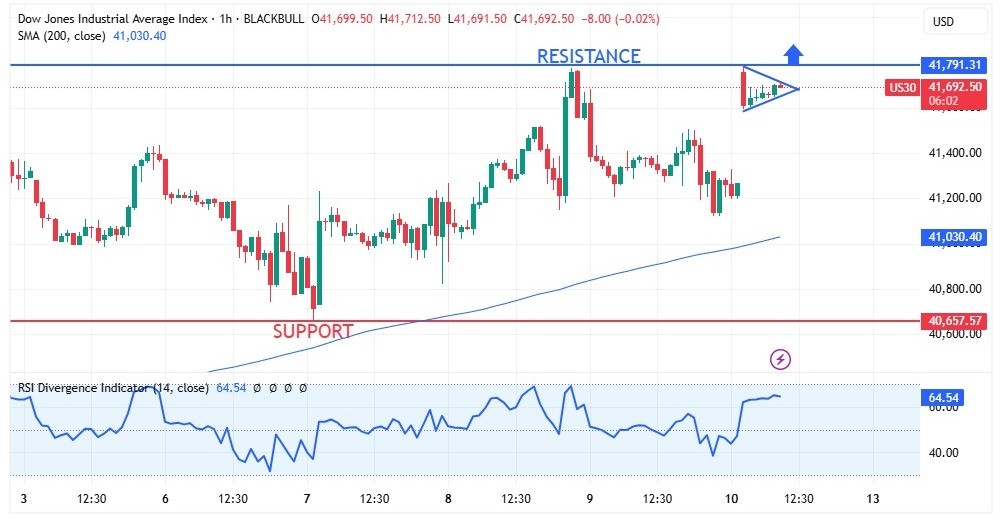
DOW JONES making a pennant pattern on re...
May 12, 2025
Market Insights
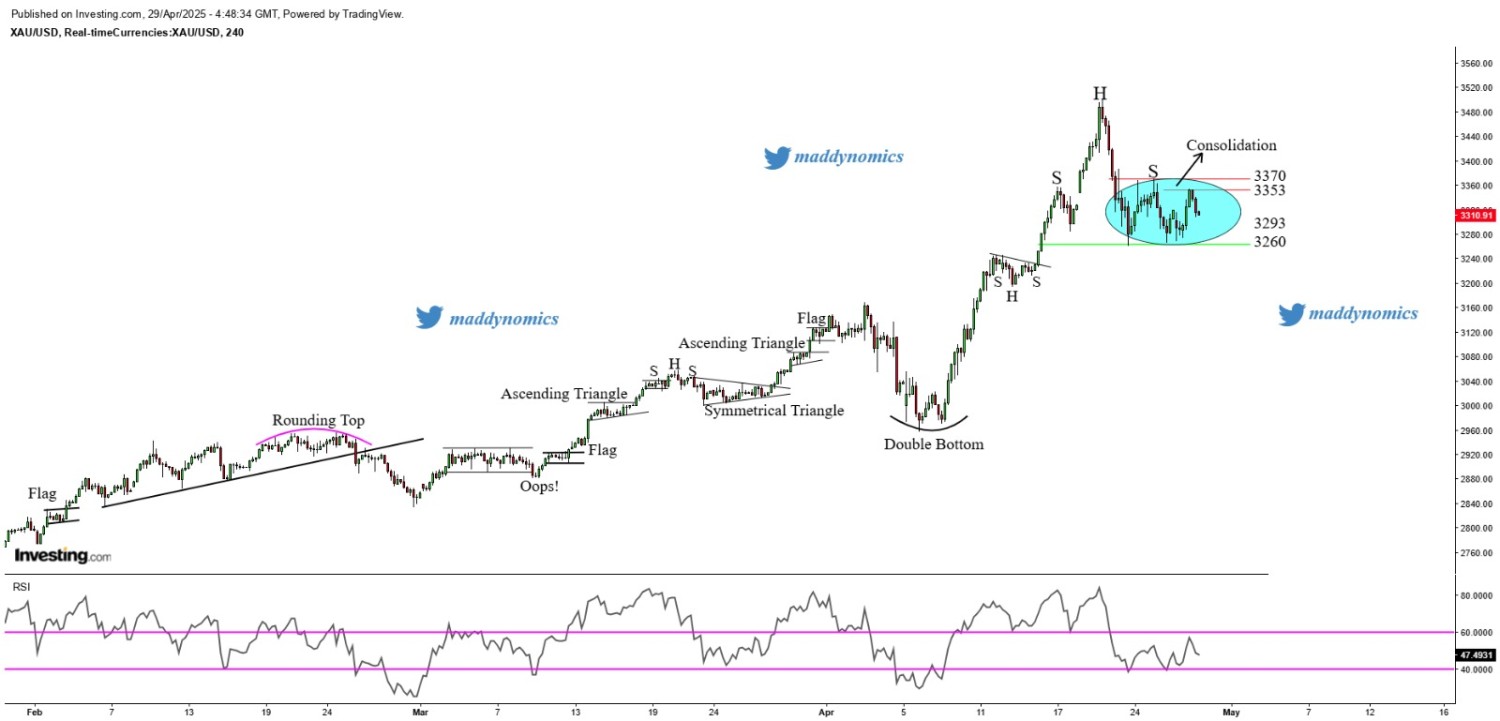
Gold consolidates but remains vulnerable...
April 29, 2025
Market Insights


