GBP/USD Eyes Bullish Breakout Amid Softer US Dollar and Strong UK GDP Data
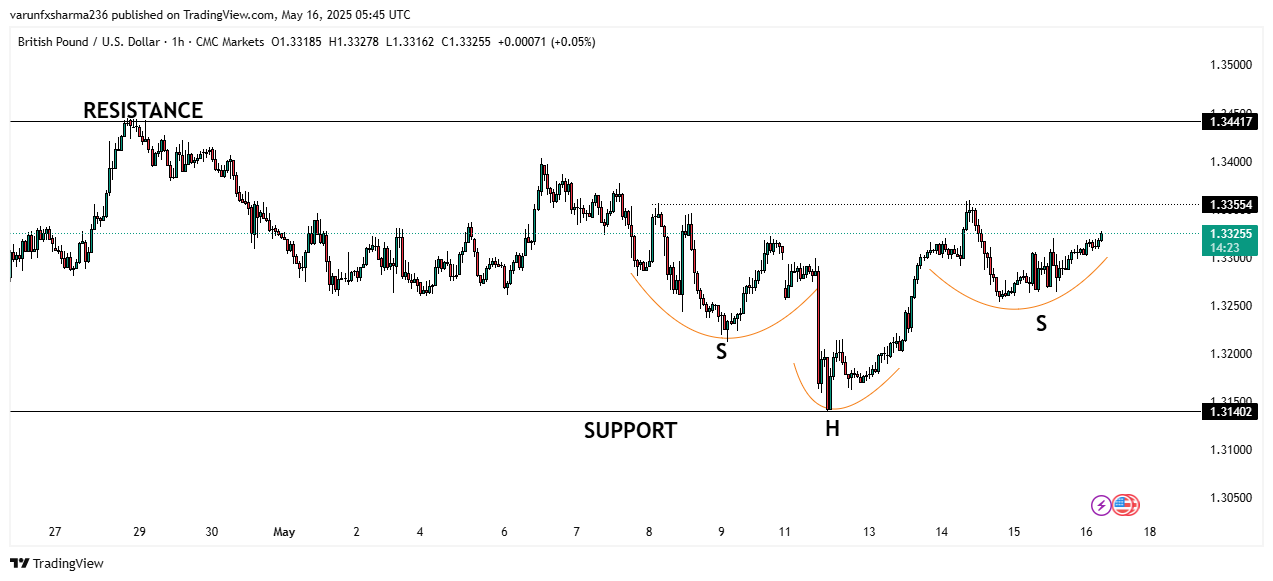
Chart Analysis: Inverse Head and Shoulders Pattern Signals Bullish Reversal
The 1-hour GBP/USD chart reveals a well-defined Inverse Head and Shoulders pattern forming above the key support level at 1.3140. This classic reversal pattern is marked by two higher lows (shoulders) and a deeper trough (head), indicating a potential shift from a downtrend to an uptrend.
-
Support Zone: 1.3140
-
Resistance Zone: 1.3355 – 1.3441
-
Pattern Neckline: Near 1.3355
If the price breaks and sustains above the 1.3355 neckline resistance, it may confirm the bullish reversal, with upside targets around the 1.3440 area.
Recent News
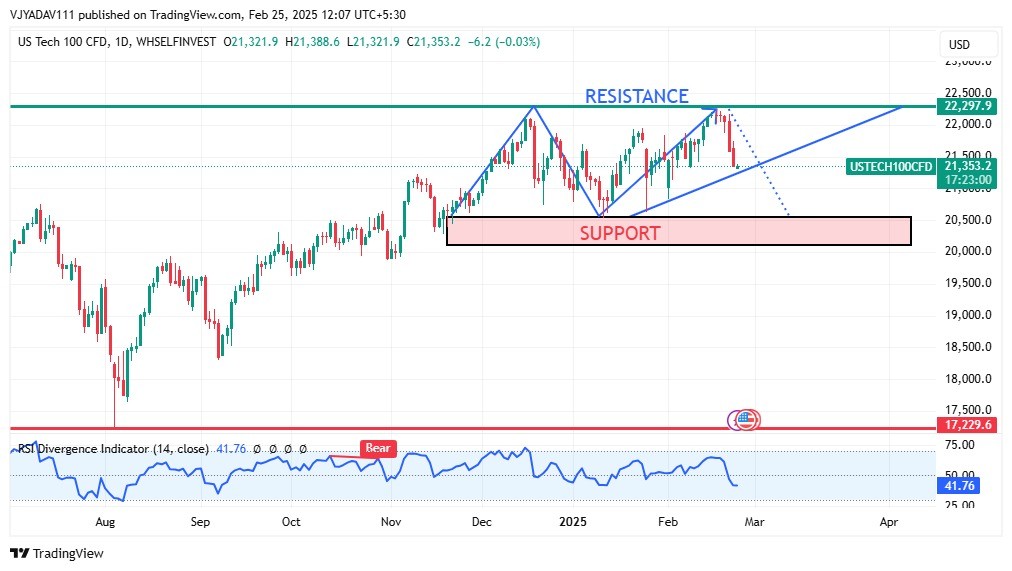
US Tech 100 Tests Key Support Zone Amid...
February 25, 2025
Market Insights

BTC/USD outlook: Bitcoin hits series of...
November 11, 2024
Market Insights
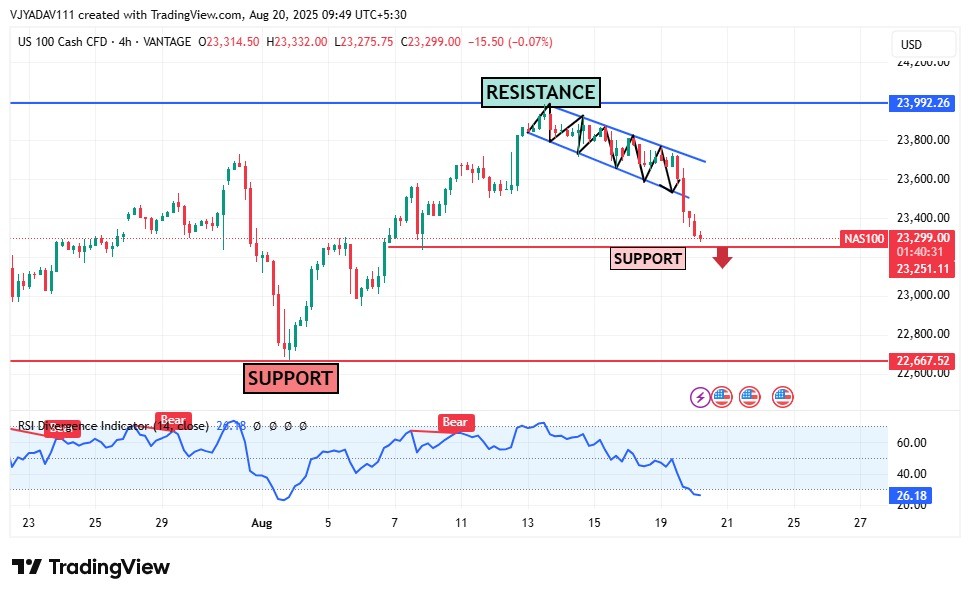
NAS100 Breaks Support After Bearish Chan...
August 20, 2025
Market Insights
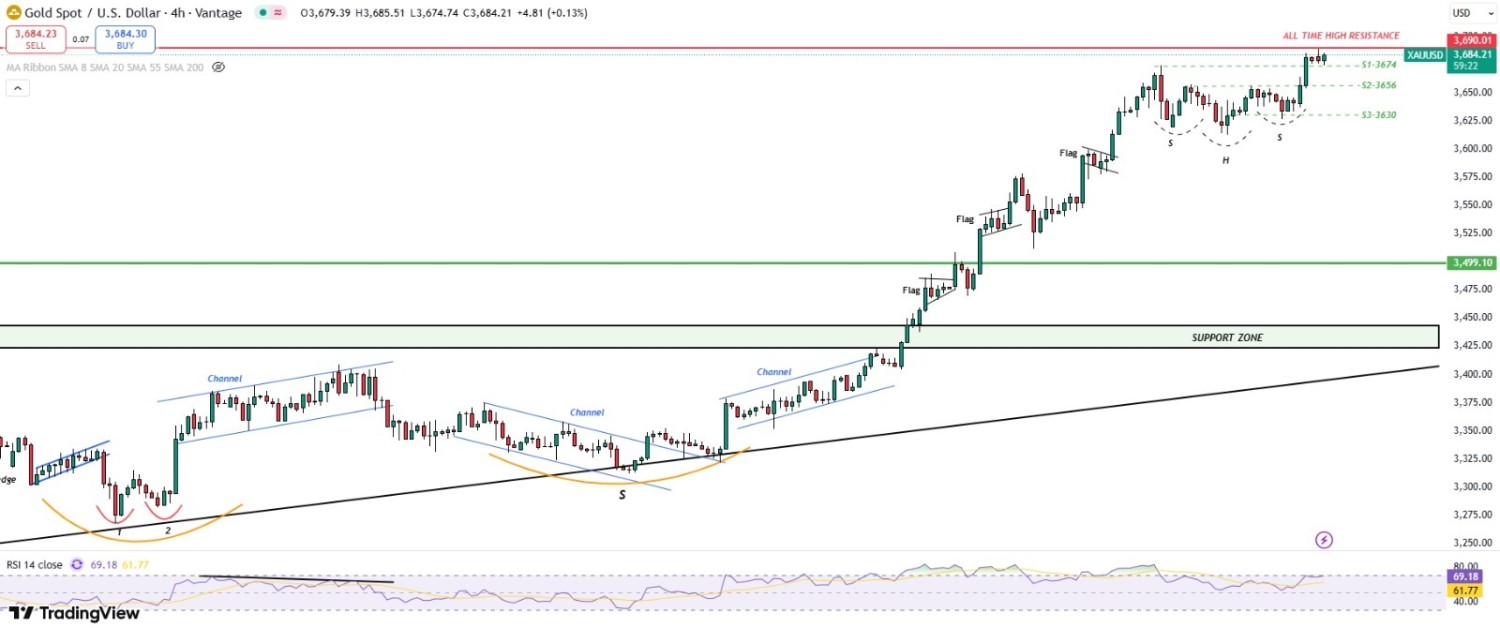
Gold: Inverted Hammer Breakout on Daily,...
September 16, 2025
Market Insights
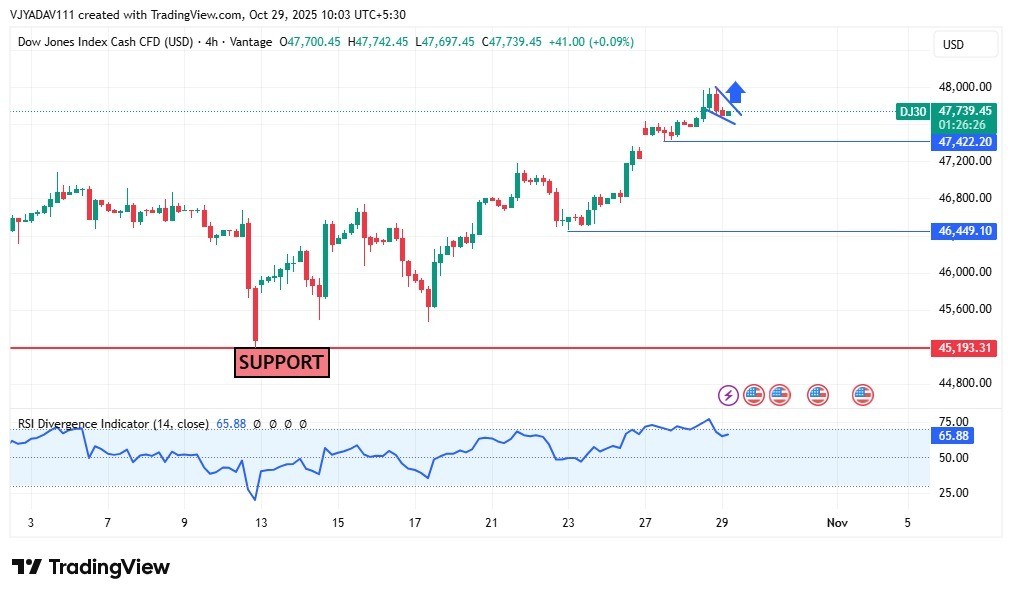
DOW JONES forming a bullish flag near 47...
October 29, 2025
Market Insights

Gold on the Brink: Awaiting NFP for the...
March 07, 2025
Market Insights


