Gold trades in the favour of bulls when PCE Price Index is round the corner
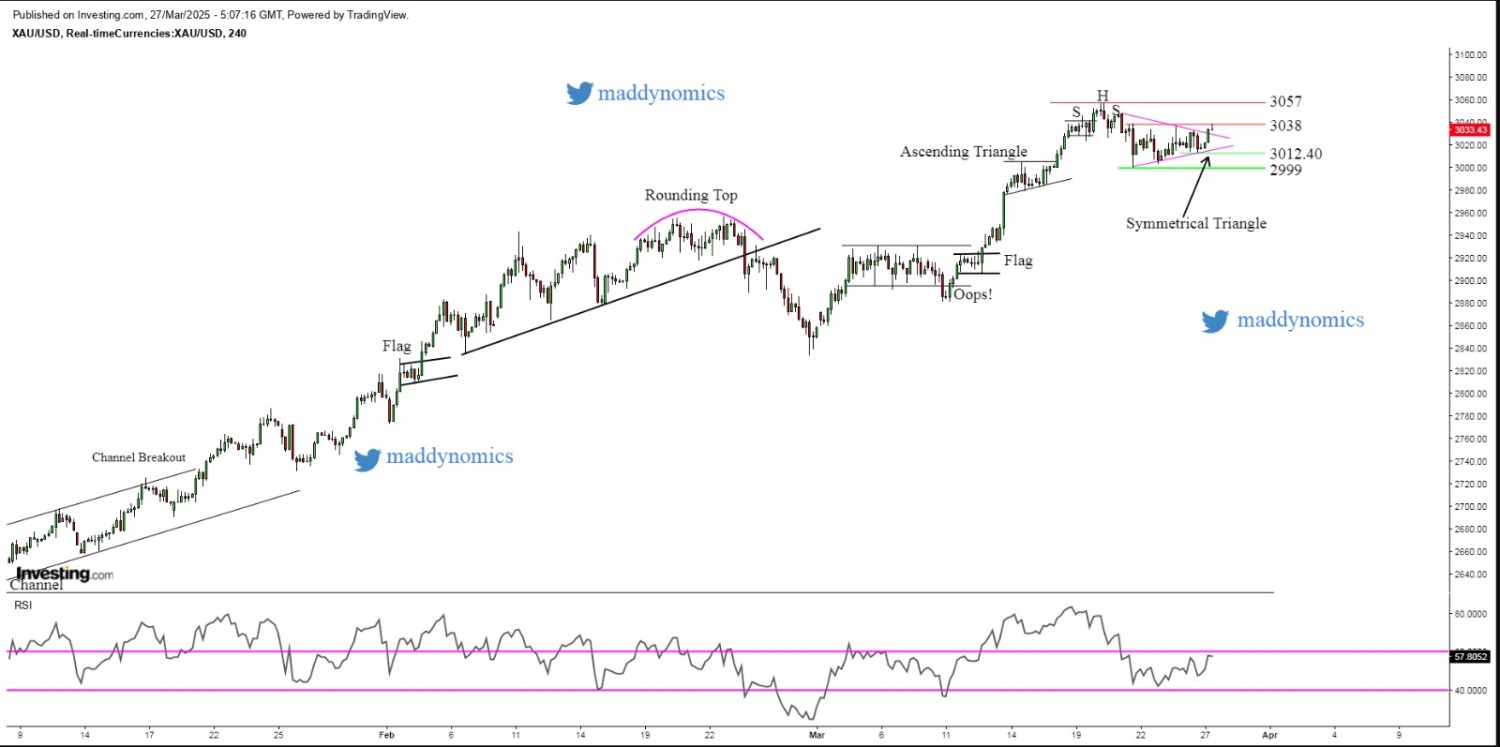
So far, after consolidating within a symmetrical triangle, Gold prices gave a breakout on the upside to rise all the way to $3038. The yellow metal captivated fresh demands amid renewed tariff threats from U.S. President, a weakening Dollar and escalating geopolitical turmoil. According to a survey, the U.S. consumer confidence plummeted to four year low of 92.9 in the month of March with households dreading higher inflation in near future because of tariffs. On Wednesday, Donald Trump announced a 25% of tariff on all auto imports to boost domestic manufacturing, receiving backlash from Japan, the EU, Canada and the UK.
Gold built gains on fresh US Dollar pullback as dampening consumer confidence weighed down on the greenback. Investors now await US Q4 GDP data and PCE Price Index, which is Fed's preferred measure of inflation, for more clarity.
Technical Overview
The technical setup on the daily chart suggests prices have been moving in a narrow range within the inside bar with more chances of a breakout above $3047. The RSI at 67.05 indicates that overall sentiment for today remains in the favour of buyers.
Gold Structure: NR3 Candle Pattern on Daily, Breakout of Symmetrical Triangle on 4hr, Doji on 1hr.
Intraday Strategy/ Intraday Trend: Buy on Supports, Buy on Breakouts/ Neutral to Bullish
Major Resistance: 3038, 3047, 3058
Major Support: 3028, 3023, 3013
Recent News
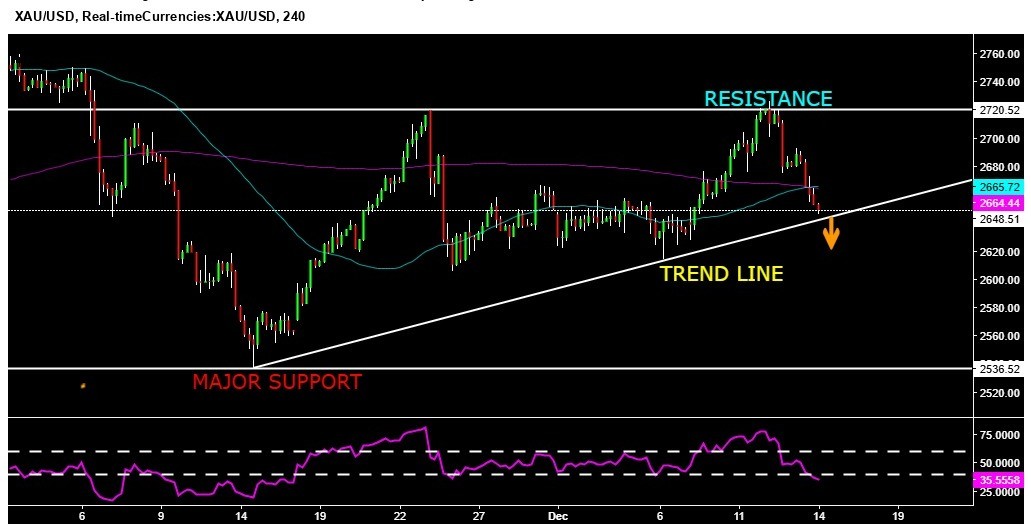
GOLD WEEKLY ANALYSIS
December 14, 2024
Market Insights
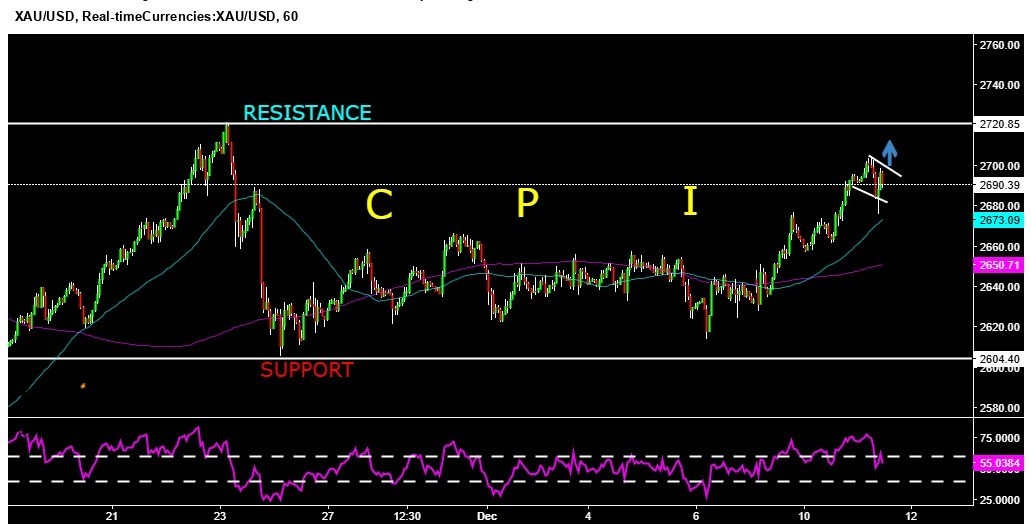
GOLD VIEW ON CPI
December 11, 2024
Market Insights
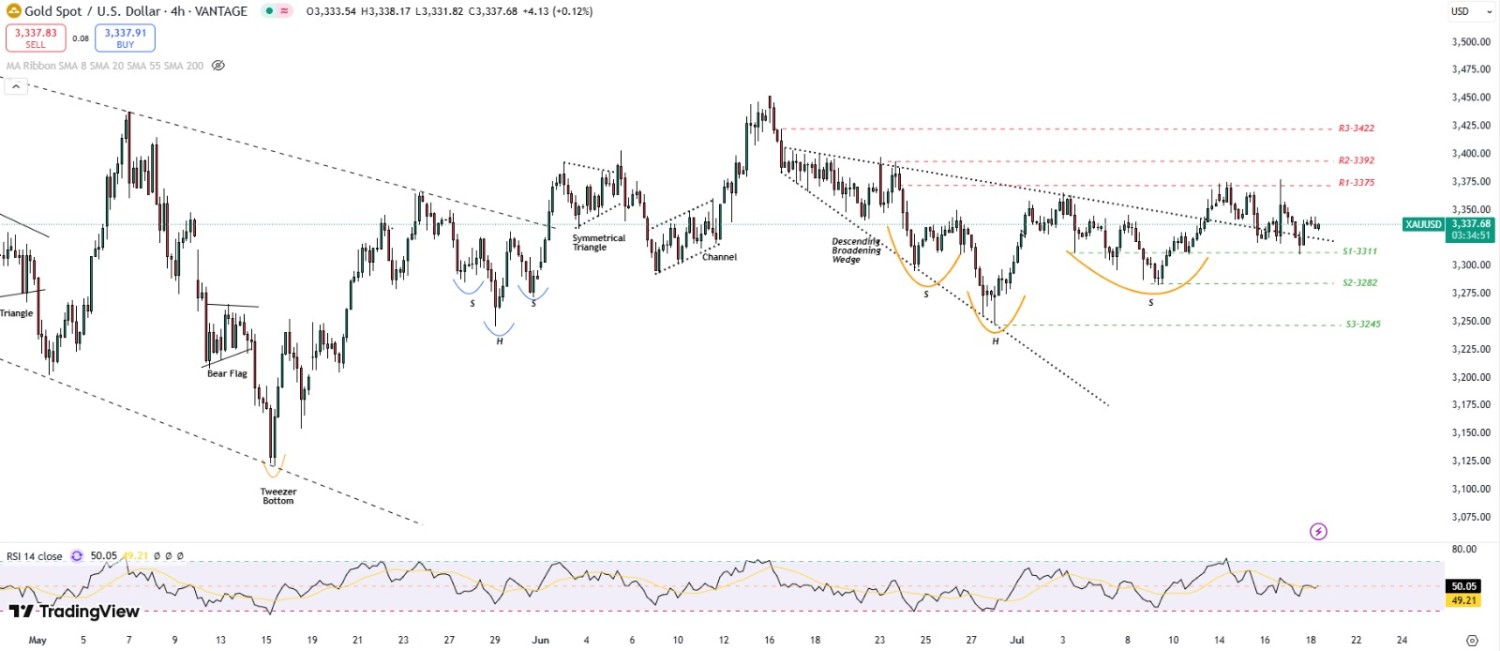
Gold slips below $3,340 as strong US dat...
July 18, 2025
Market Insights
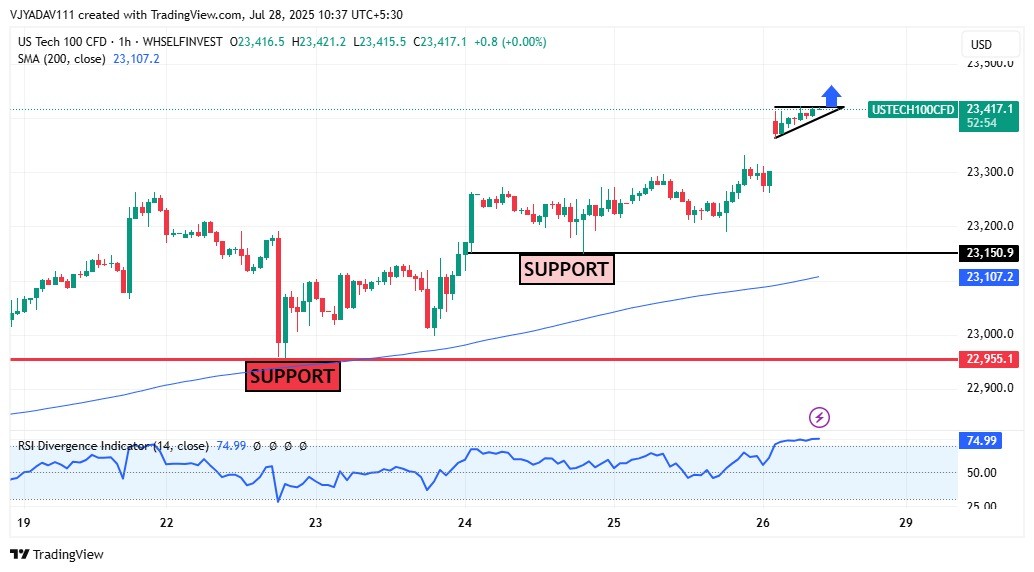
US Tech 100 Eyes Breakout Bullish Pennan...
July 28, 2025
Market Insights
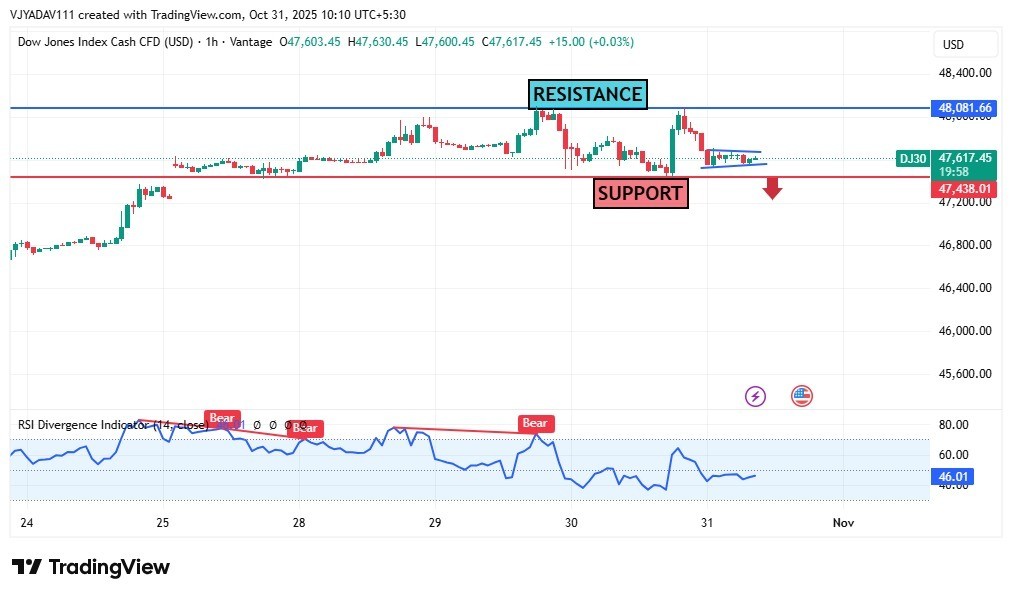
Dow Jones Struggles Below Resistance as...
October 31, 2025
Market Insights
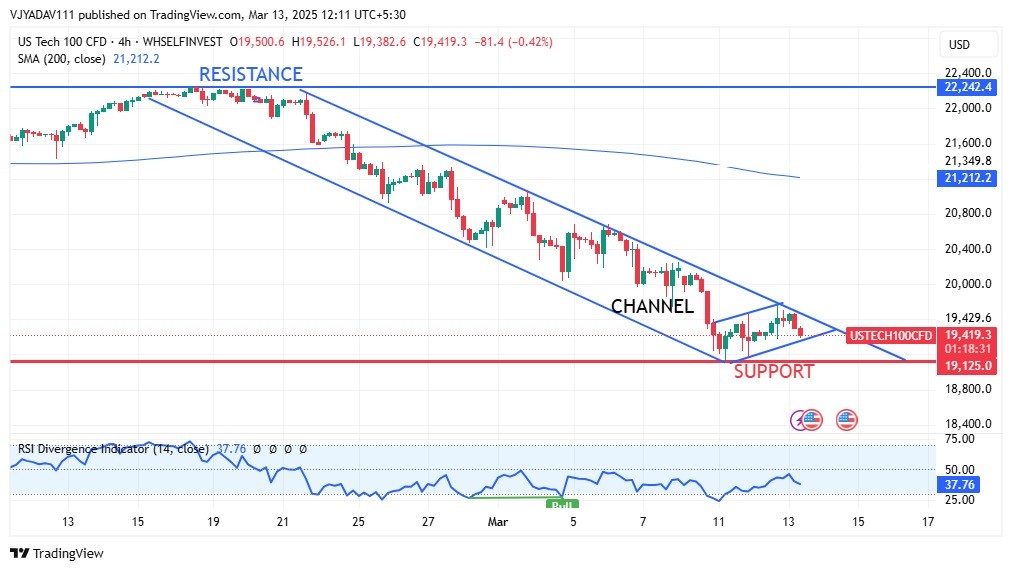
Nasdaq 100 Approaching Key Support Zone...
March 13, 2025
Market Insights


