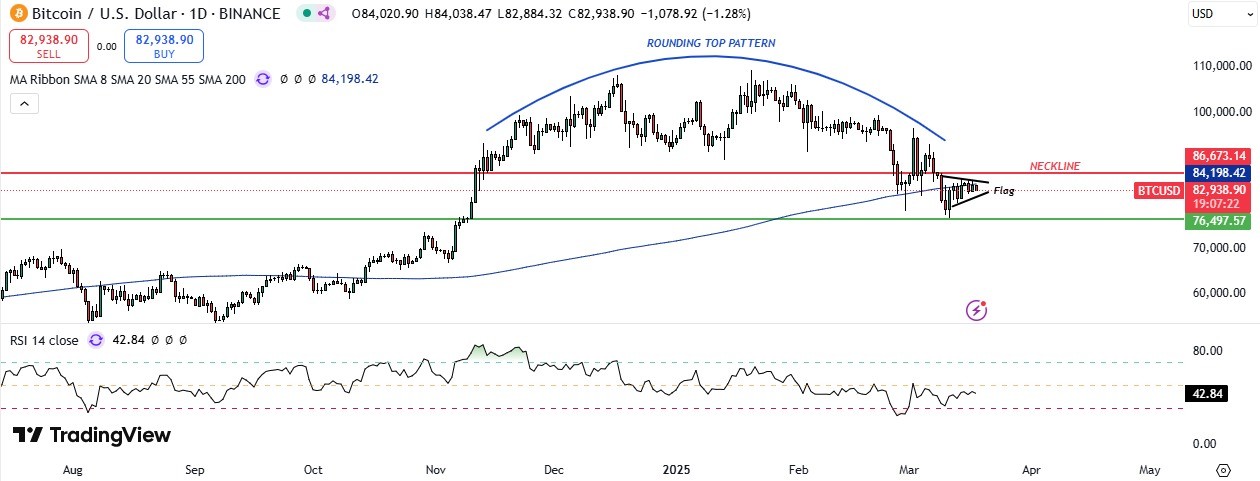
Bitcoin remains capped under $84000, lacks bullish momentum.
Bitcoin prices are often linked with giant tech stocks and Nasdaq's price movement. According to Peter Schiff's prediction, Nasdaq's decline could pose a threat on bitcoin prices. Furthermore, US Spot Bitcoin ETFs experienced over $1.6 billion of outflows in the first half of March amid trade war tensions and economic uncertainty, putting pressure on bitcoin prices.
Technically, there is no sign of further bullish momentum as prices struggle to breach the psychological resistance of $90000 above which bitcoin would resume its rally in the positive direction. On the downside, breaking the key support zone of $76000-$72000 would result in massive correction.
BITCOIN DAILY TECHNICAL OVERVIEW
Technical Structure: Rounding top on daily, Below 200 SMA, Bearish flag on daily, Consolidation on 1H.
Weekly Trend: Downtrend
Intraday Trend/ Intraday Strategy: Bearish/ Sell on Support breakdown
Major Support: 82000, 79000, 76000
Major Resistance: 86500, 90000, 94500
Recent News
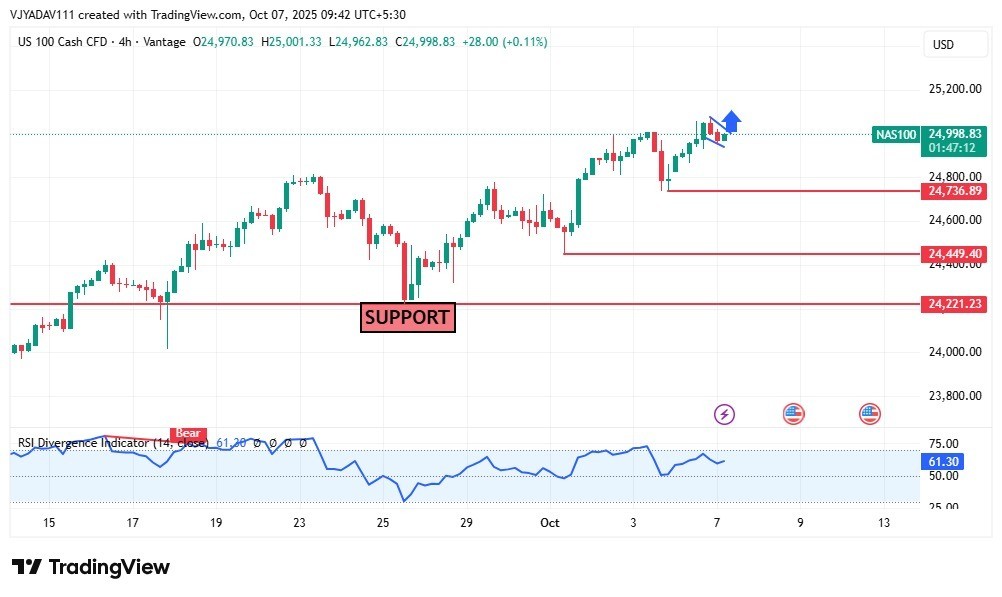
NASDAQ making a bullish flag on all time...
October 07, 2025
Market Insights
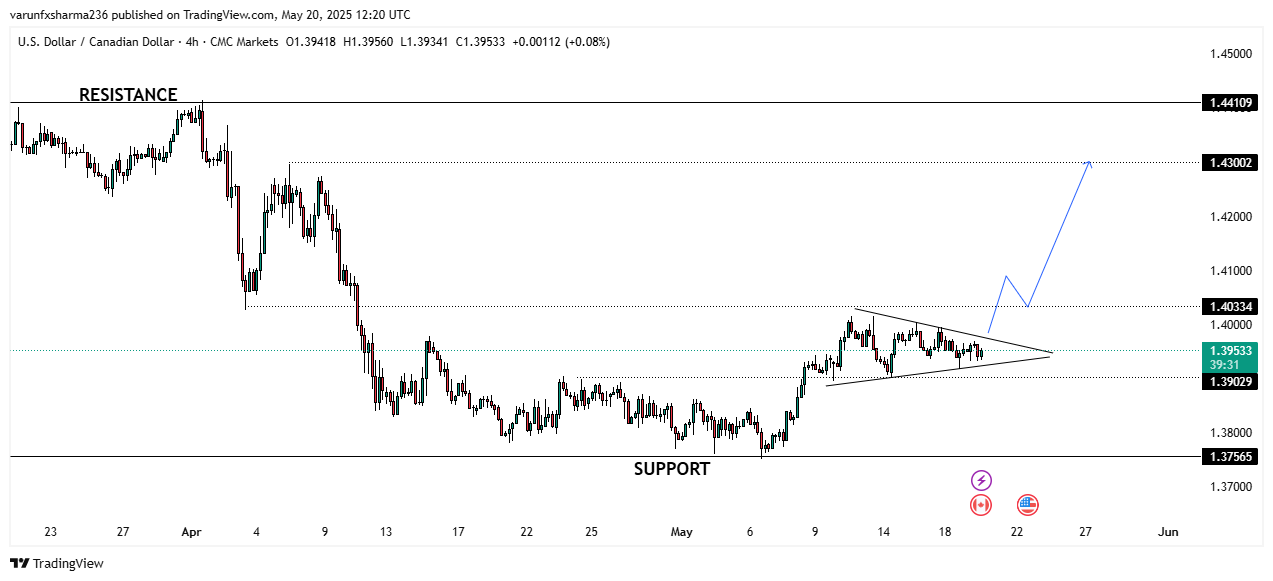
USD/CAD Coils Within Triangle Pattern Ah...
May 20, 2025
Market Insights
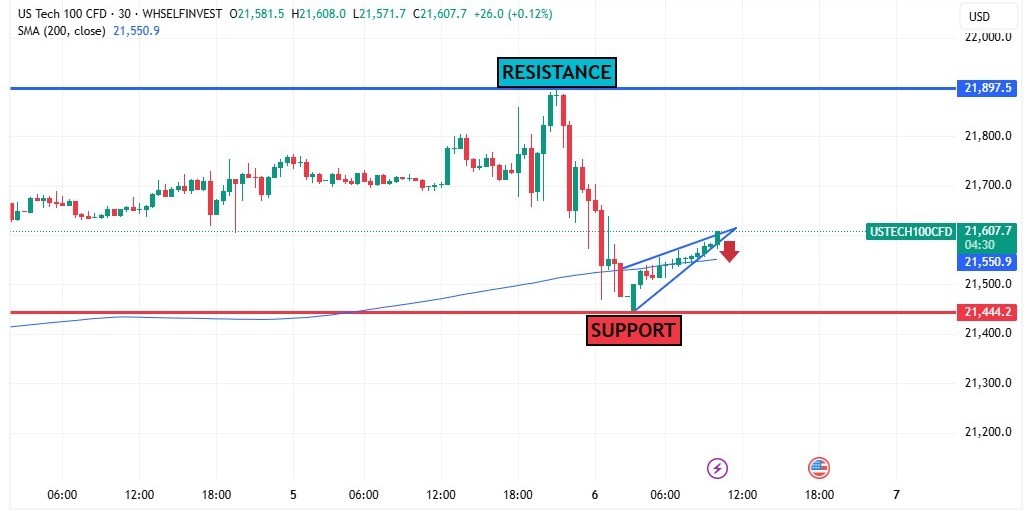
NASDAQ making a wedge pattern in short t...
June 06, 2025
Market Insights
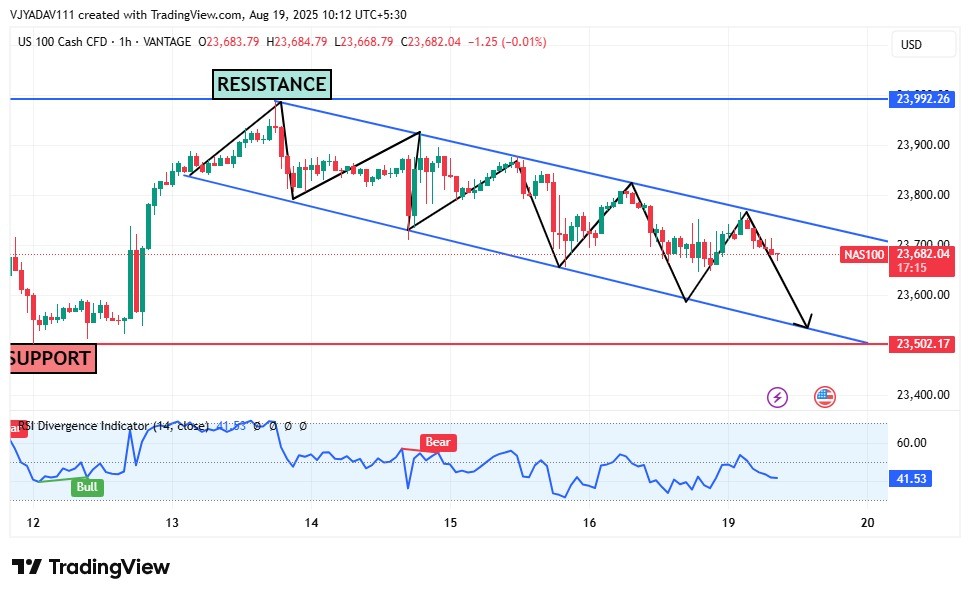
NASDAQ 100 Faces Continued Selling Press...
August 19, 2025
Market Insights

Gold Glitters But Faces a Moment of Caut...
April 15, 2025
Market Insights
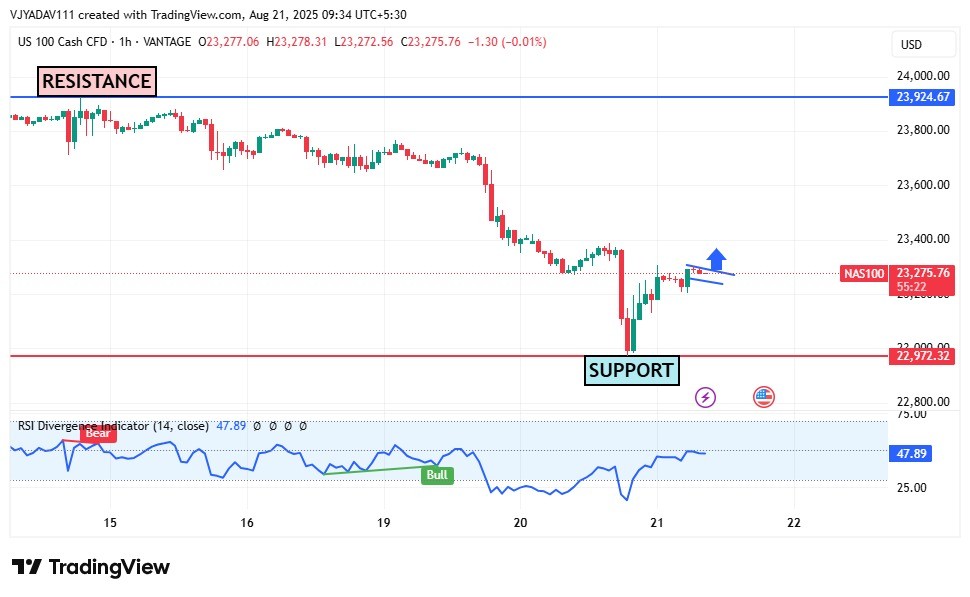
NASDAQ 100 Forms Bullish Flag Near Suppo...
August 21, 2025
Market Insights


