Gold ends up in the negative territory amid reducing safe haven demand: Head & Shoulder pattern adds to the bearish bias
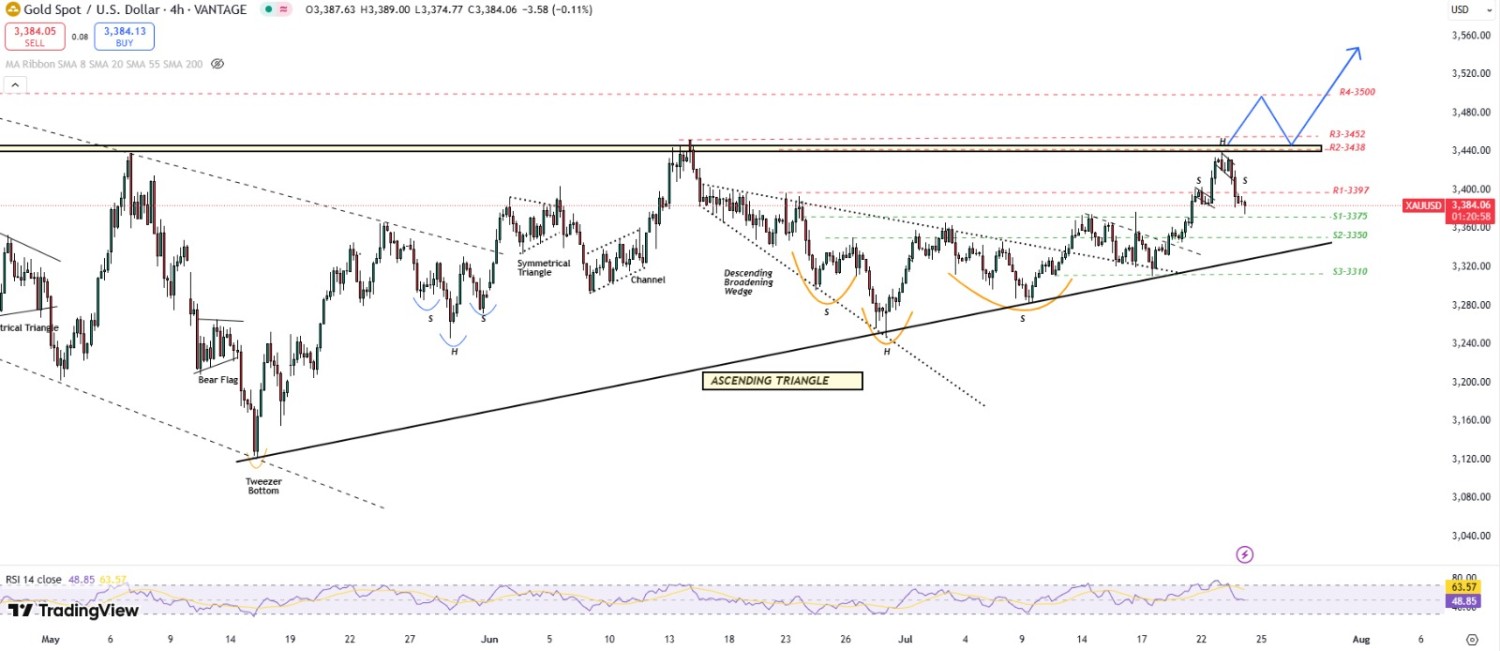
Gold prices extended their decline on Thursday, slipping to a three-day low near $3,370 during the early European session. Risk-on sentiment, driven by optimism around the US-Japan trade deal and progress in US-EU tariff talks, weakened safe-haven demand, leading to follow-through selling in gold for a second consecutive day.
Meanwhile, a modest rebound in the US Dollar from multi-week lows added pressure on gold. However, lingering uncertainty over the Fed’s rate-cut outlook and concerns over central bank independence may limit USD strength and provide some support for gold in the near term. Traders now await global flash PMI data and key US macro releases for fresh direction.
XAU/USD TECHNICAL OVERVIEW
Technical Structure: Gold displays a mixed technical structure, with a Bearish Engulfing pattern on the daily chart, despite holding above the 20-day Simple moving average. On the 4-hour chart, a Doji candle indicates indecision, while the 1-hour chart reveals a potential Head & Shoulder pattern, suggesting a possible short term reversal.
Weekly Trend: Neutral
Intraday Trend/ Intraday Strategy: The intraday bias remains bearish and favours the approach of Selling on Support Breakdown and Selling on Rise
Major Support: 3370, 3350, 3330
Major Resistance: 3397, 3420, 3438
Recent News
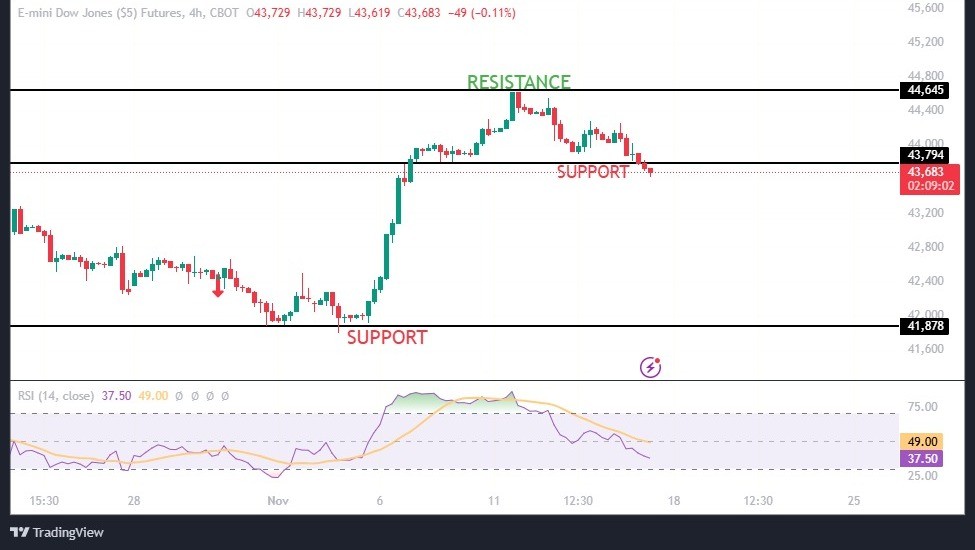
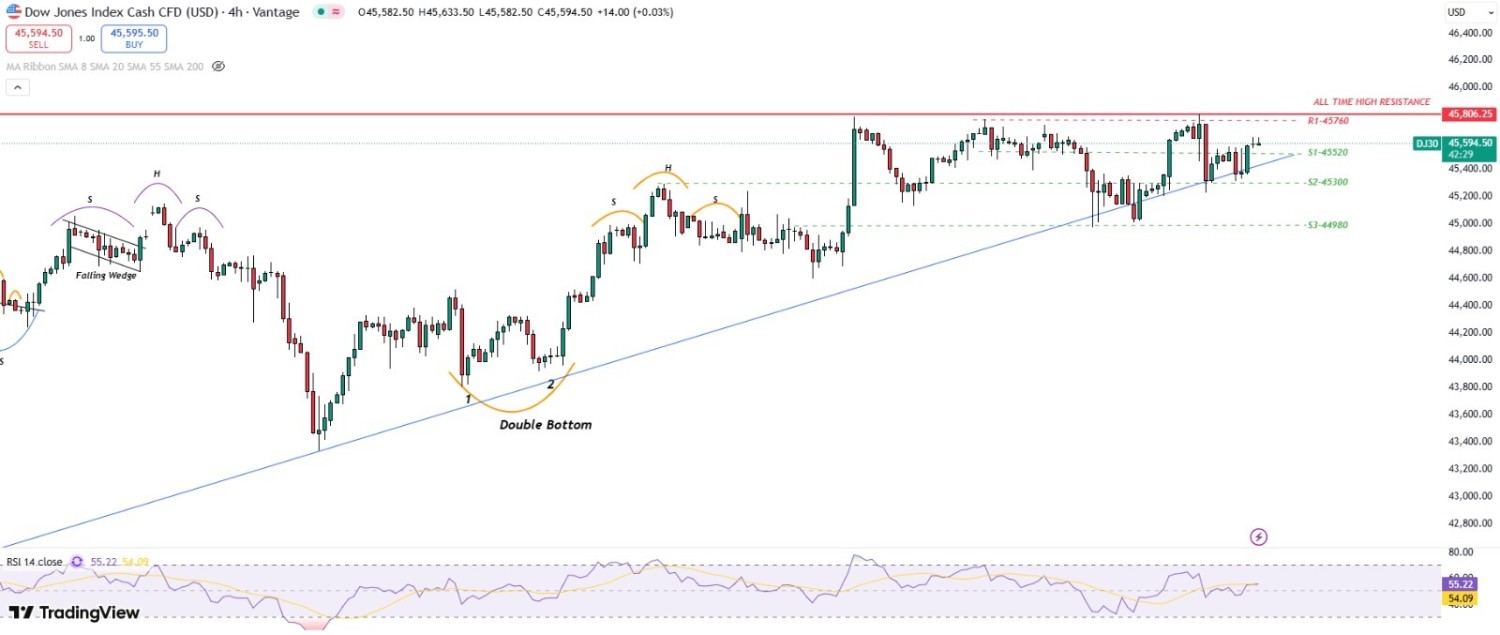
DOW JONES ANALYSIS
November 15, 2024
Live Charts
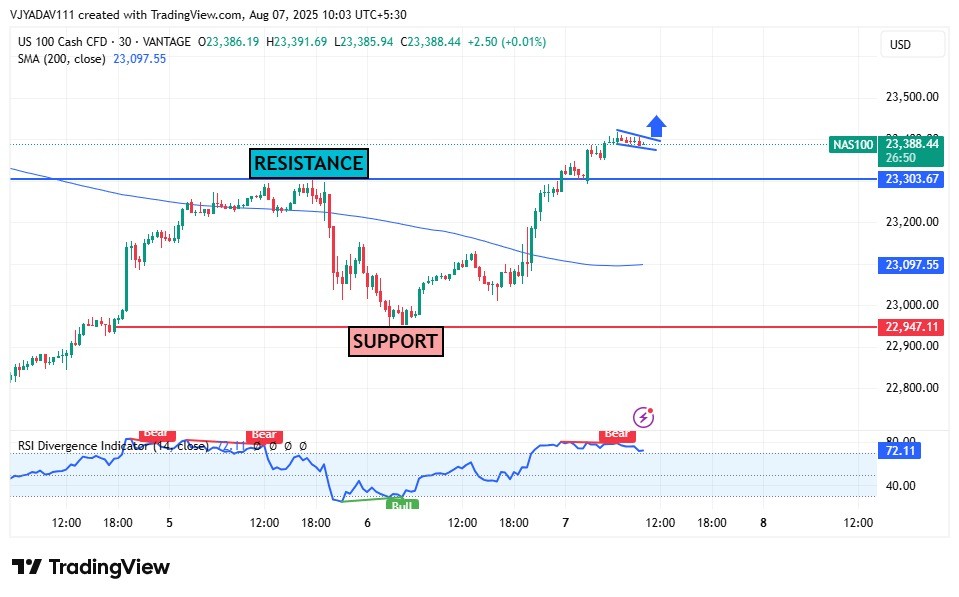
NAS100 Attempts Bullish Breakout Above 2...
August 07, 2025
Market Insights
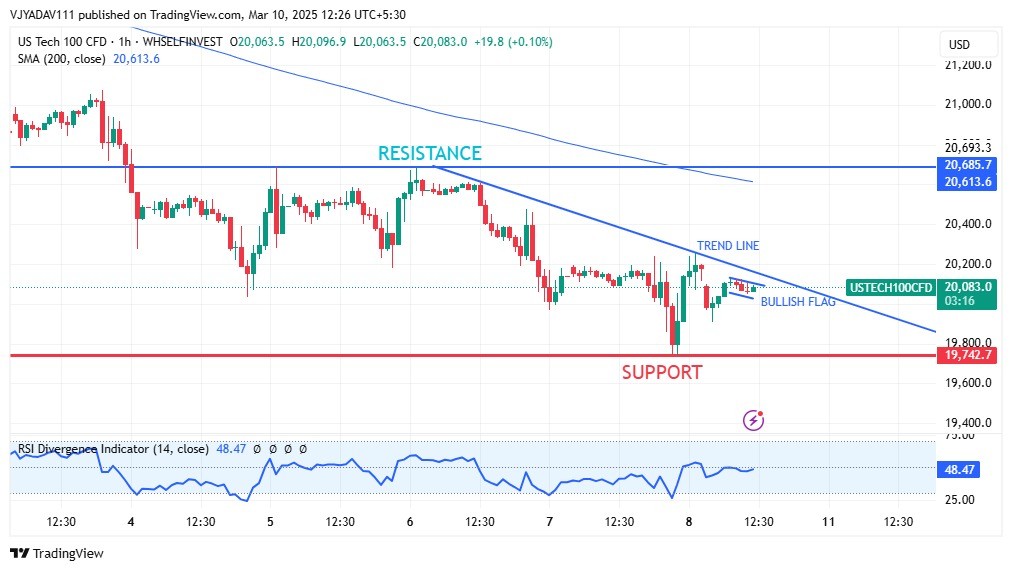
Tech Index Eyes Breakout Bullish Flag Fo...
March 10, 2025
Market Insights

NFP to Ignite Gold's Next Big Move Will...
March 07, 2025
Market Insights
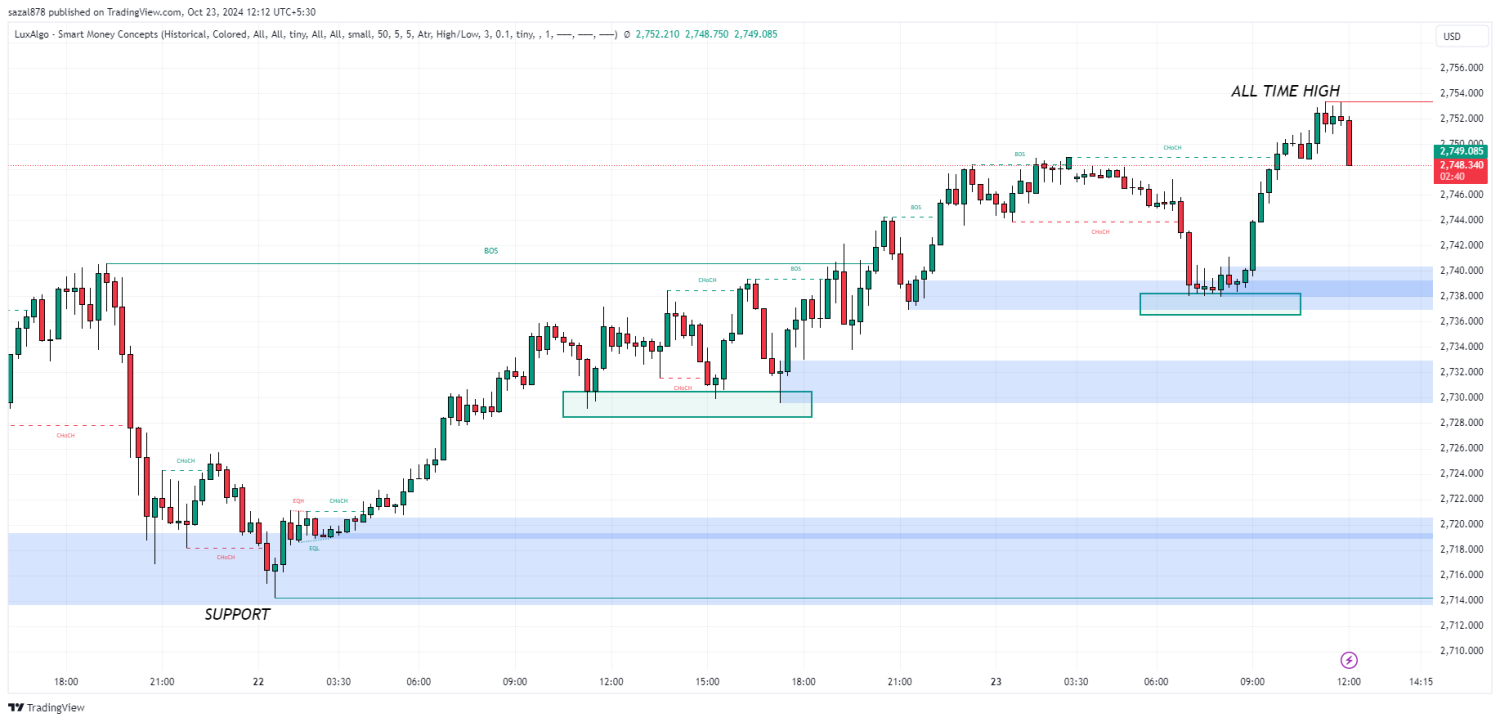
GOLD RALLY 2750!!! WHAT IS NEXT?
October 23, 2024
Market Insights
Daily Structure: Bullish Flag formation;...
September 09, 2025
Market Insights


