V-shaped recovery in Gold! The yellow metal rallies back to $2920.
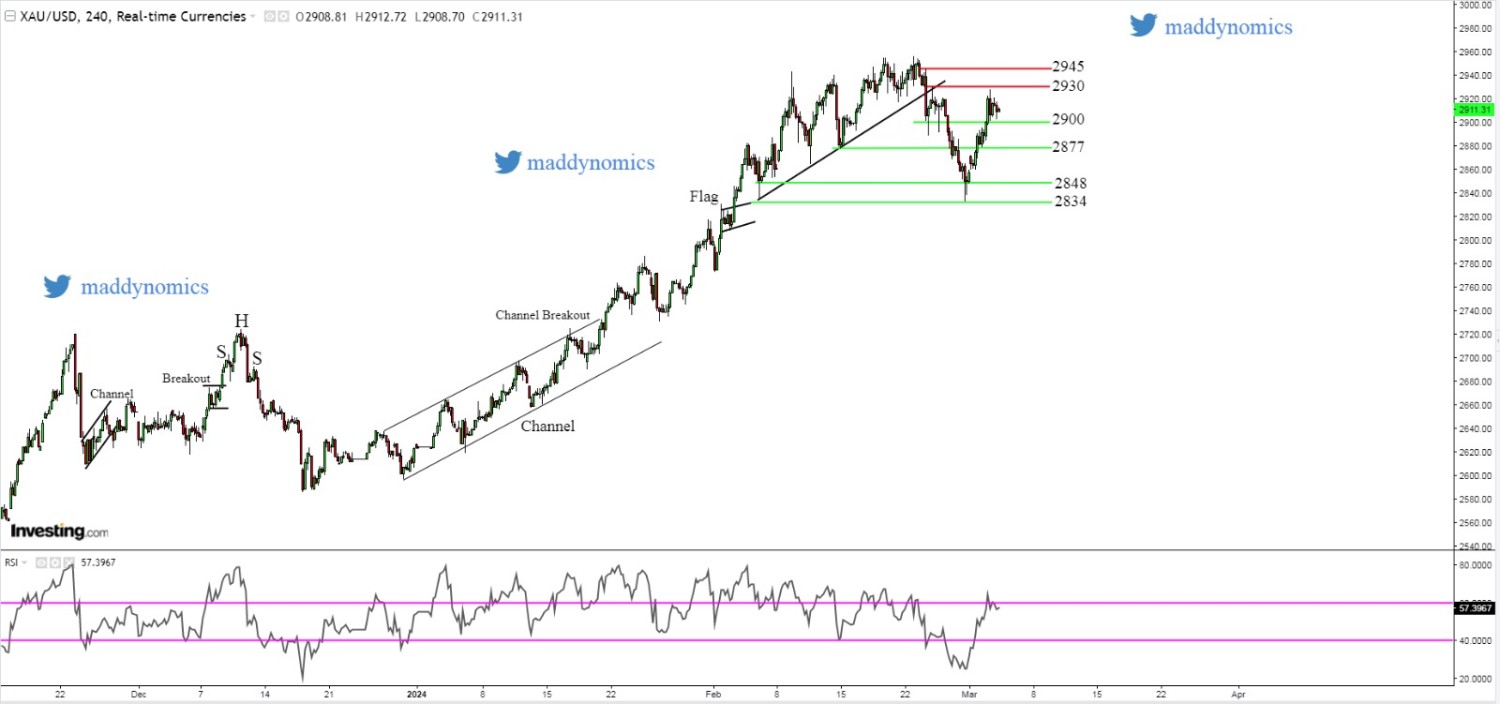
It seems like bulls are not yet ready to give up as Gold prices strongly reversed after hitting a low of 2900 in Tuesday's session. Uncertainty looming around a peace deal between Russia and Ukraine and an ongoing trade war boost the demand for this safe haven asset. A strong bullish candle on the daily chart of Gold suggests further positive momentum along with an inverted head and shoulder pattern formed on 4H timeframe. Weekly trend is bullish to neutral so buying on support and selling on resistance strategy seems fit. Crucial support lies at 2901, 2895 & 2887 while important resistance levels to watch out for are 2915, 2921 & 2928.
Recent News
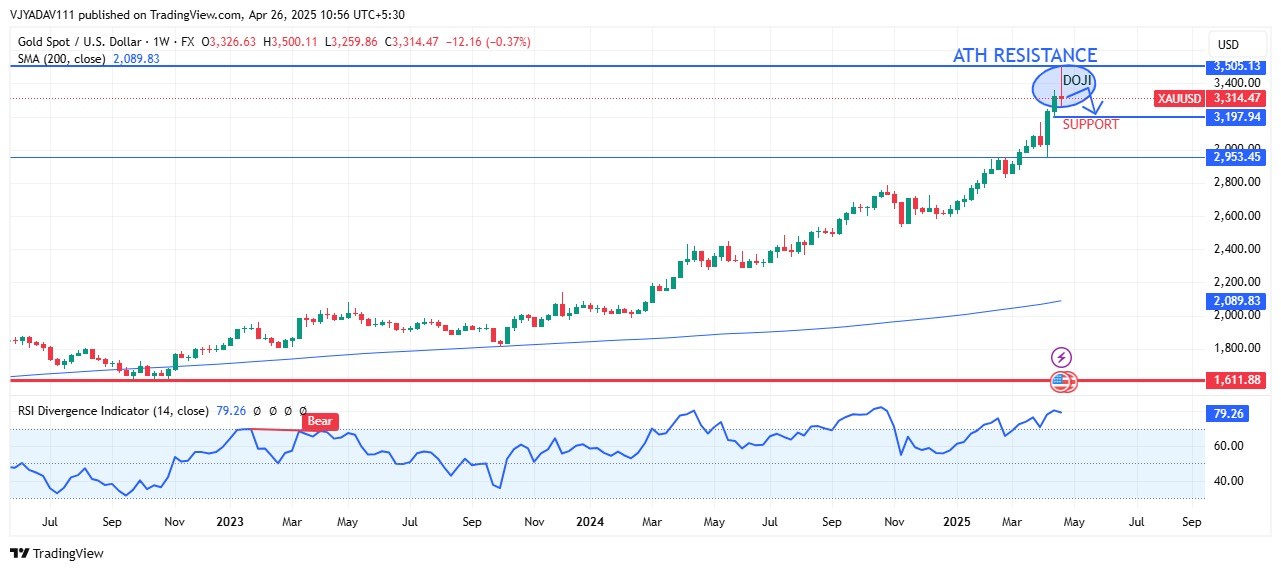
GOLD TESTS ALL TIME HIGH RESISTANCE NEAR...
April 26, 2025
Market Insights
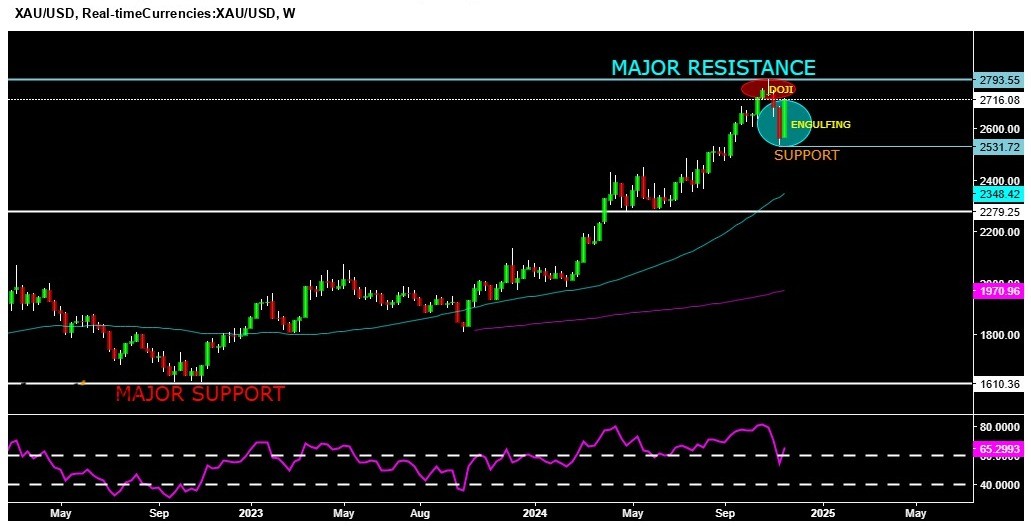
XAUUSD
November 23, 2024
Market Insights
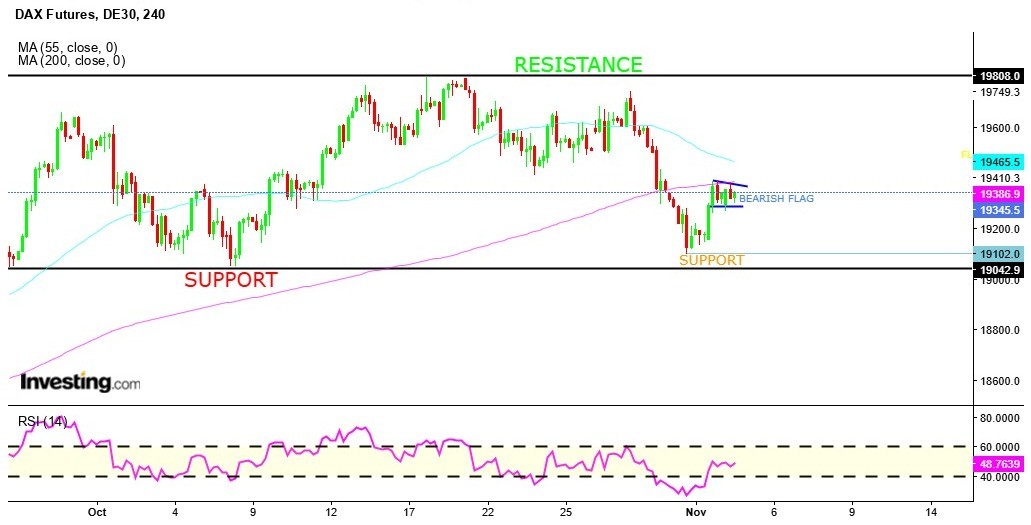
DAX bounce back from daily support level...
November 04, 2024
Market Insights

Gold Holds Breath Ahead of US CPI Inflat...
February 12, 2025
Market Insights
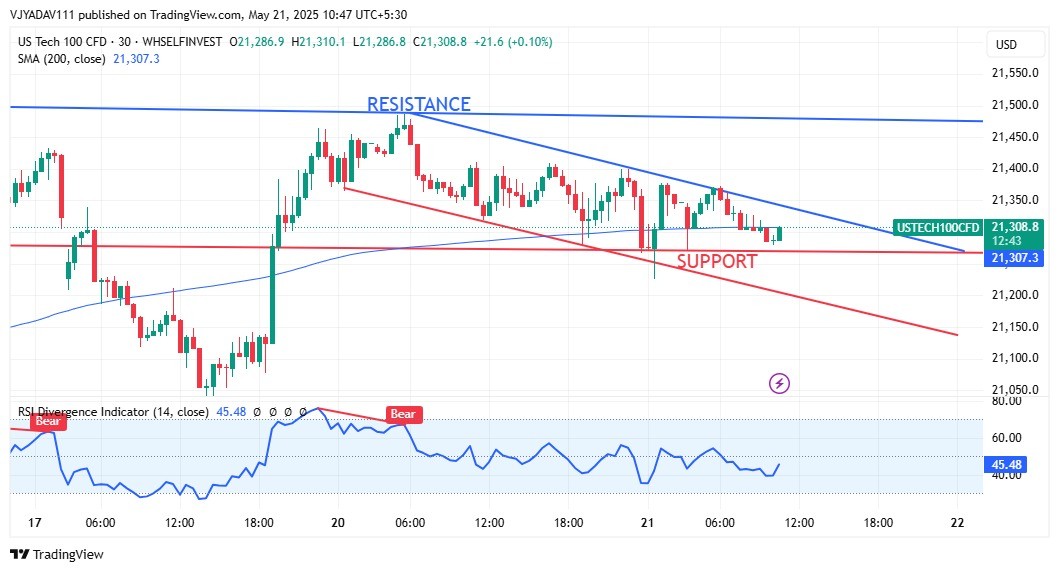
US Tech 100 at Crossroads Descending Cha...
May 21, 2025
Market Insights
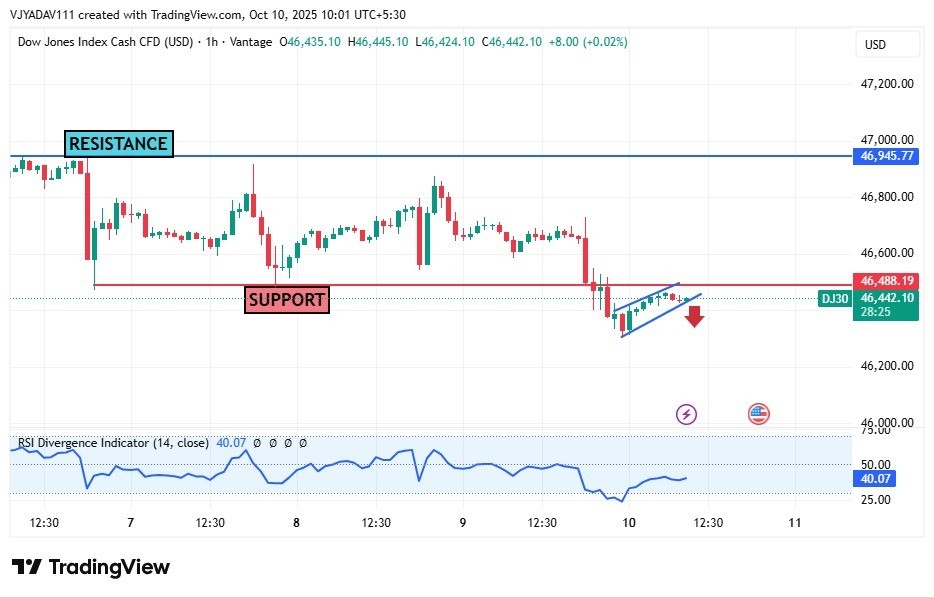
DOW JONES making a bearish flag in one h...
October 10, 2025
Market Insights


