Nasdaq/US 100 Analysis
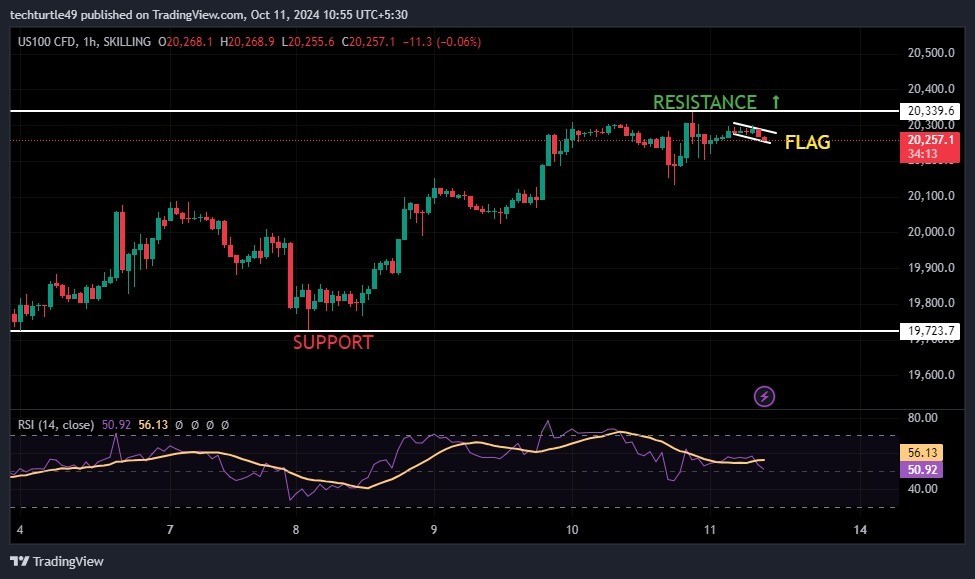
Technical Structure NASDAQ SPOT: Making bullish pattern in 4 hr time frame.
Trend: BULLISH INTRADAY
Action: BUY ON RESISTANCE BREAKOUT
R3: 20420
R2: 20360
R1: 20310
Pivot D : 20257
S1: 20200
S2: 20150
S3: 20090
Recent News
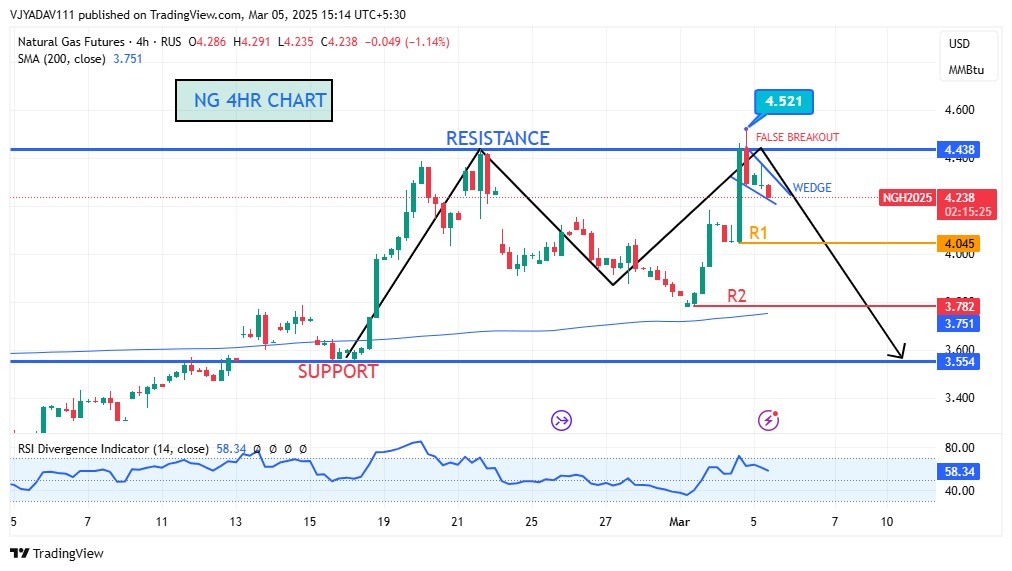
Natural Gas 4HR Chart False Breakout at...
March 05, 2025
Market Insights
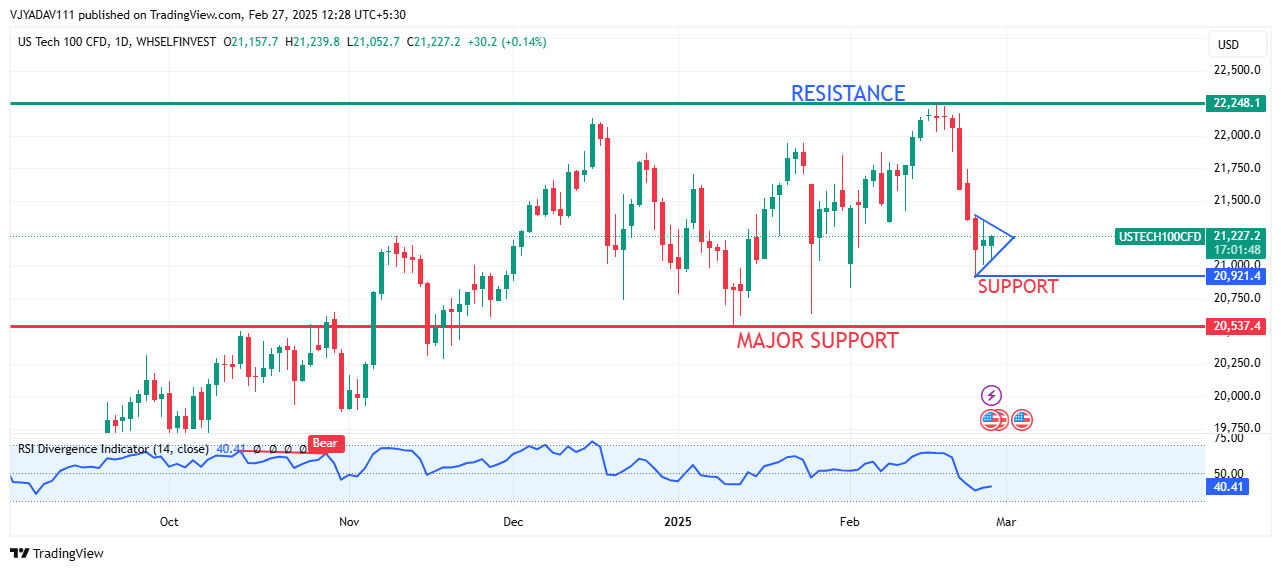
NASDAQ tumbles sharply from its all time...
February 27, 2025
Market Insights
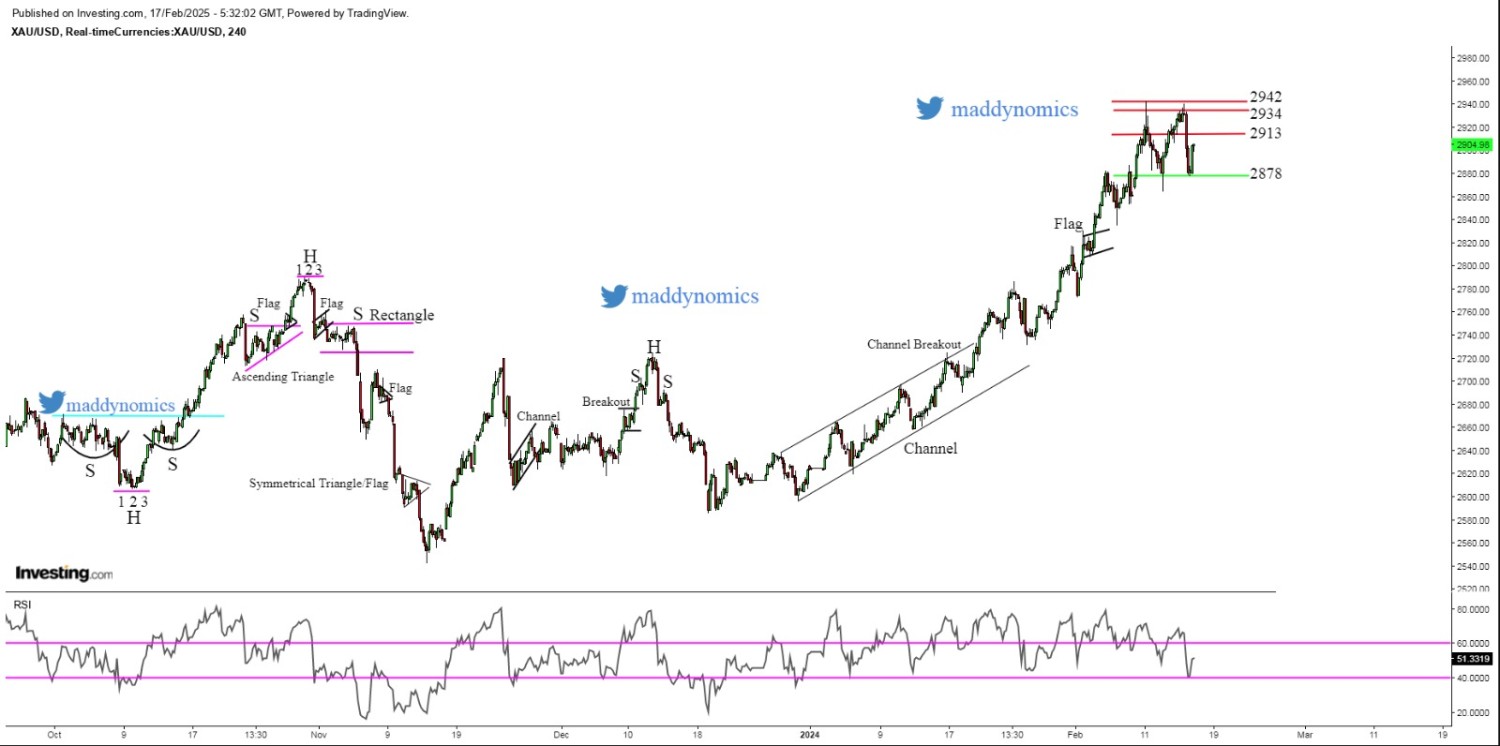
Gold in Tight Range as US Banks are off...
February 17, 2025
Market Insights
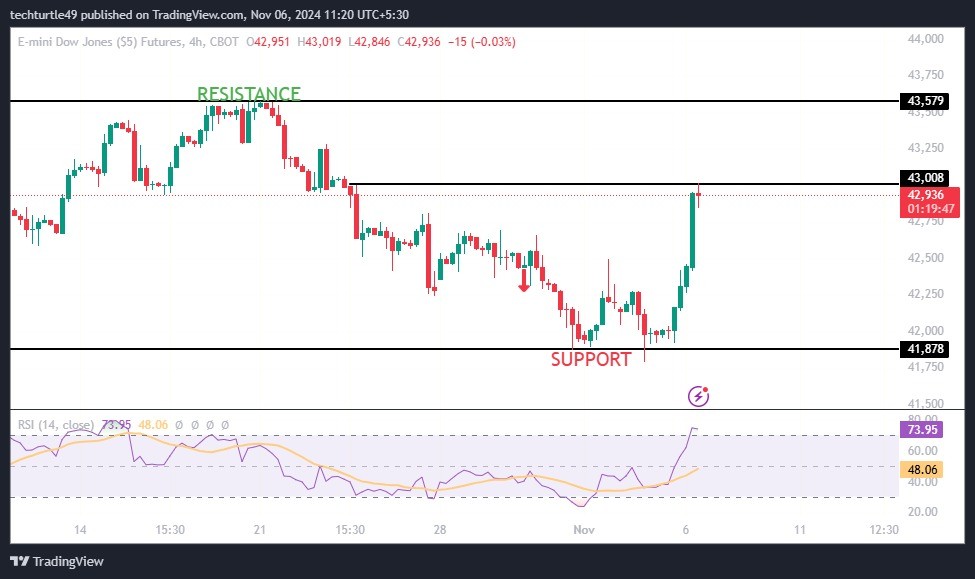
Dow Jones Industrial Average: Overview
November 06, 2024
Market Insights
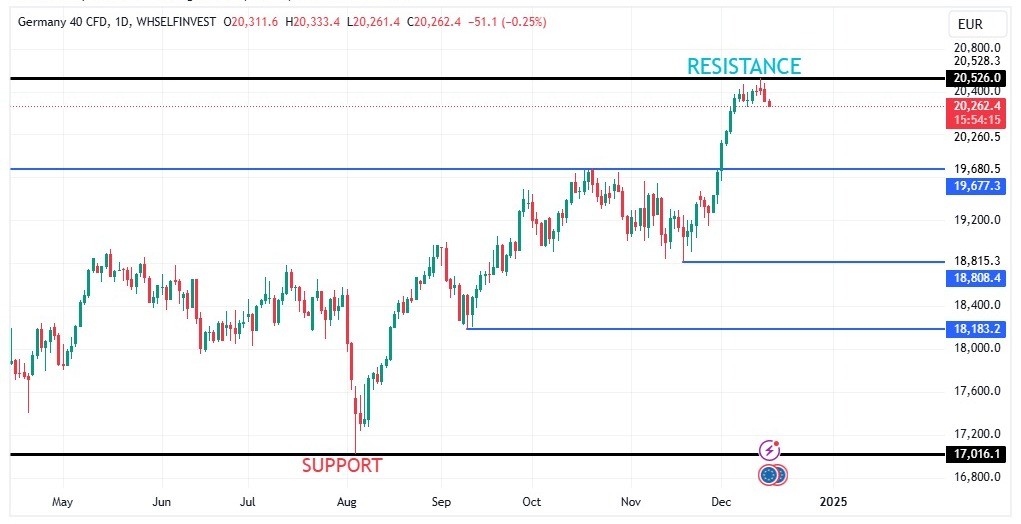
DAX sharp fall after made a Doji Pattern
December 17, 2024
Market Insights
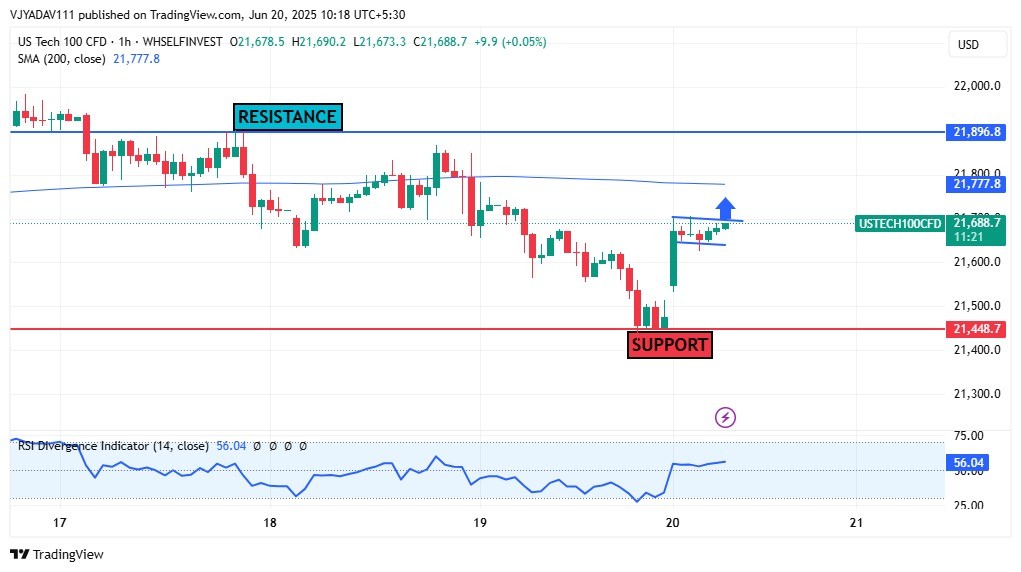
NASDAQ bounce on 4hr support, making bul...
June 20, 2025
Market Insights


