US Tech 100 Forms Bearish Triangle Pattern – Breakdown Below 200 SMA in Focus
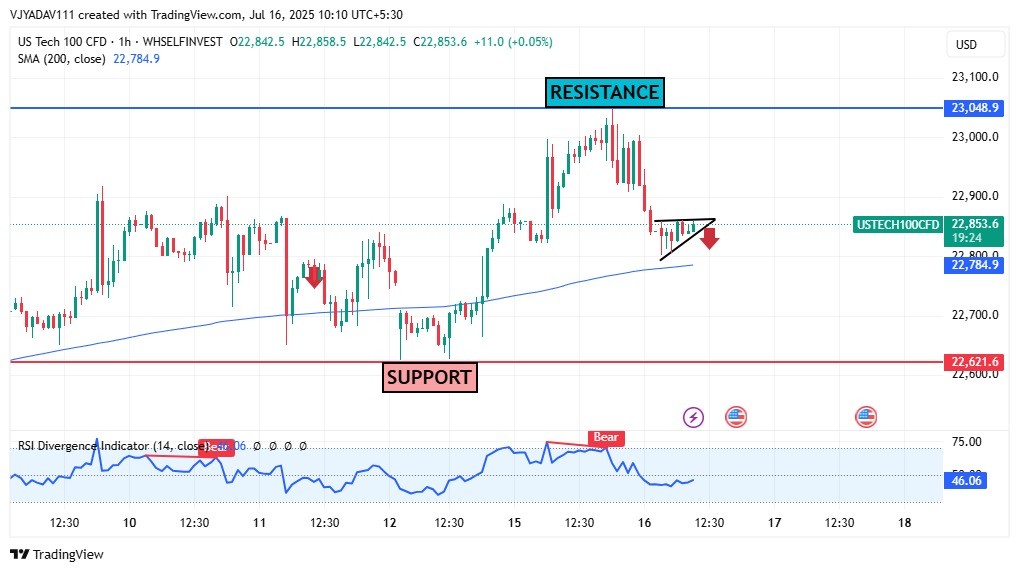
NASDAQ was down on Wednesday morning after testing the high level of 23043 in the last trading session as on the economic front, June’s PPI report is in focus, as markets seek further clarity on how President Trump’s tariff policies are influencing producer prices and inflation trends.
Recent News

Oil Prices Climb for Second Day Amid Fre...
February 25, 2025
Market Insights
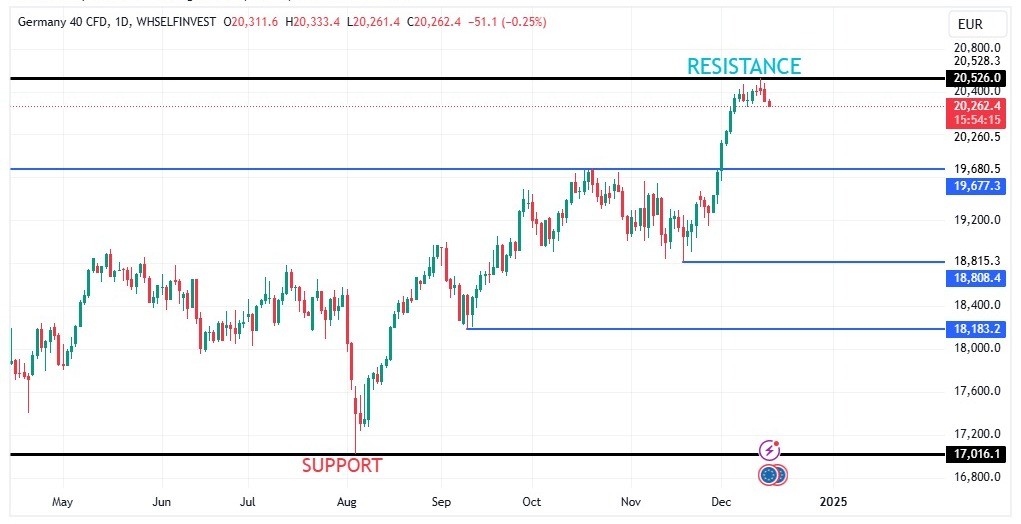
DAX sharp fall after made a Doji Pattern
December 17, 2024
Market Insights
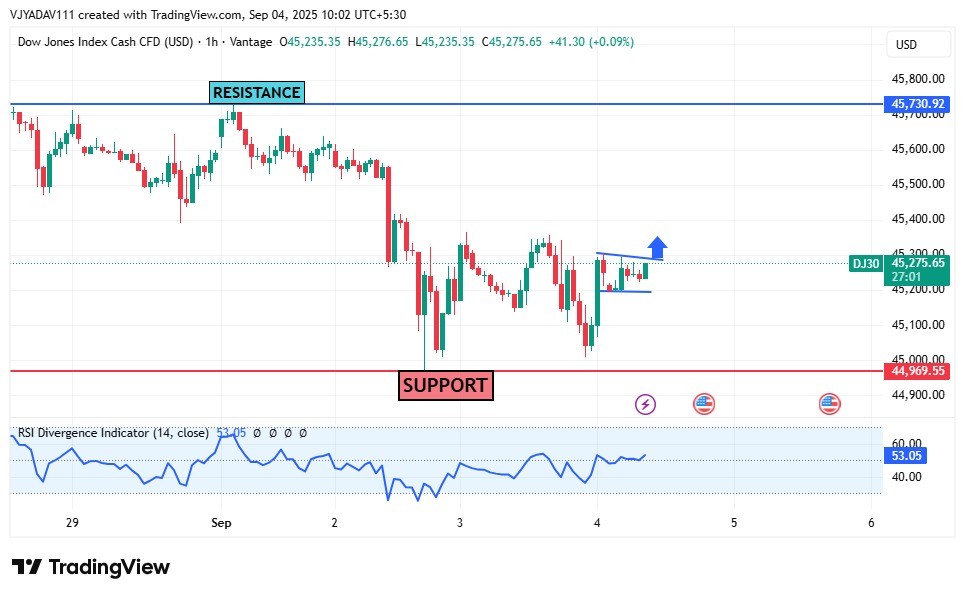
Dow Jones (US30) Forms Short-Term Base N...
September 04, 2025
Market Insights
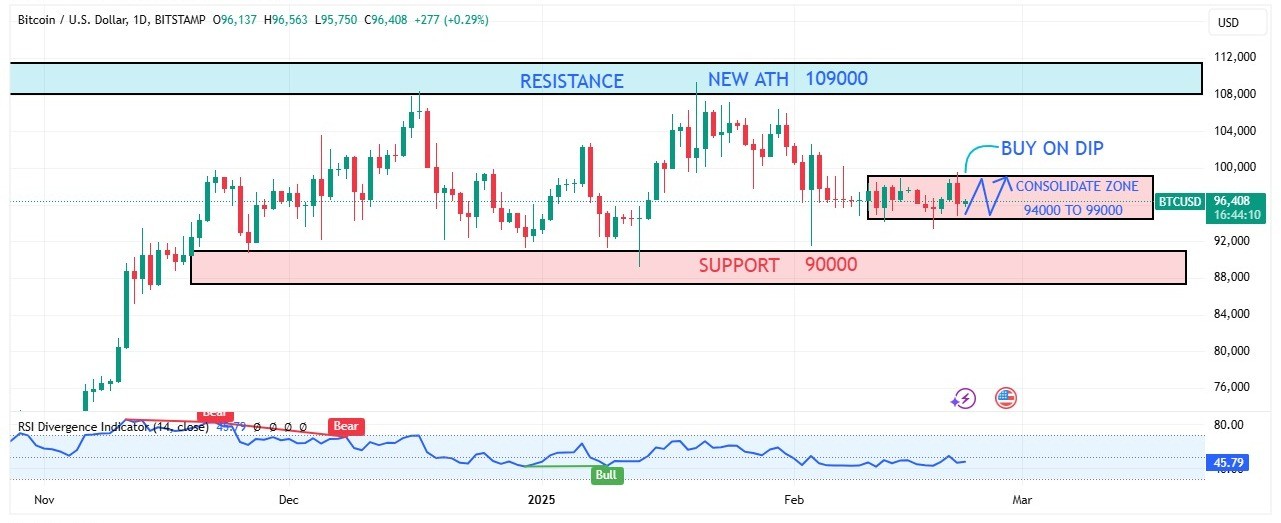
BTC on the Brink: Consolidation at $94K-...
February 22, 2025
Market Insights
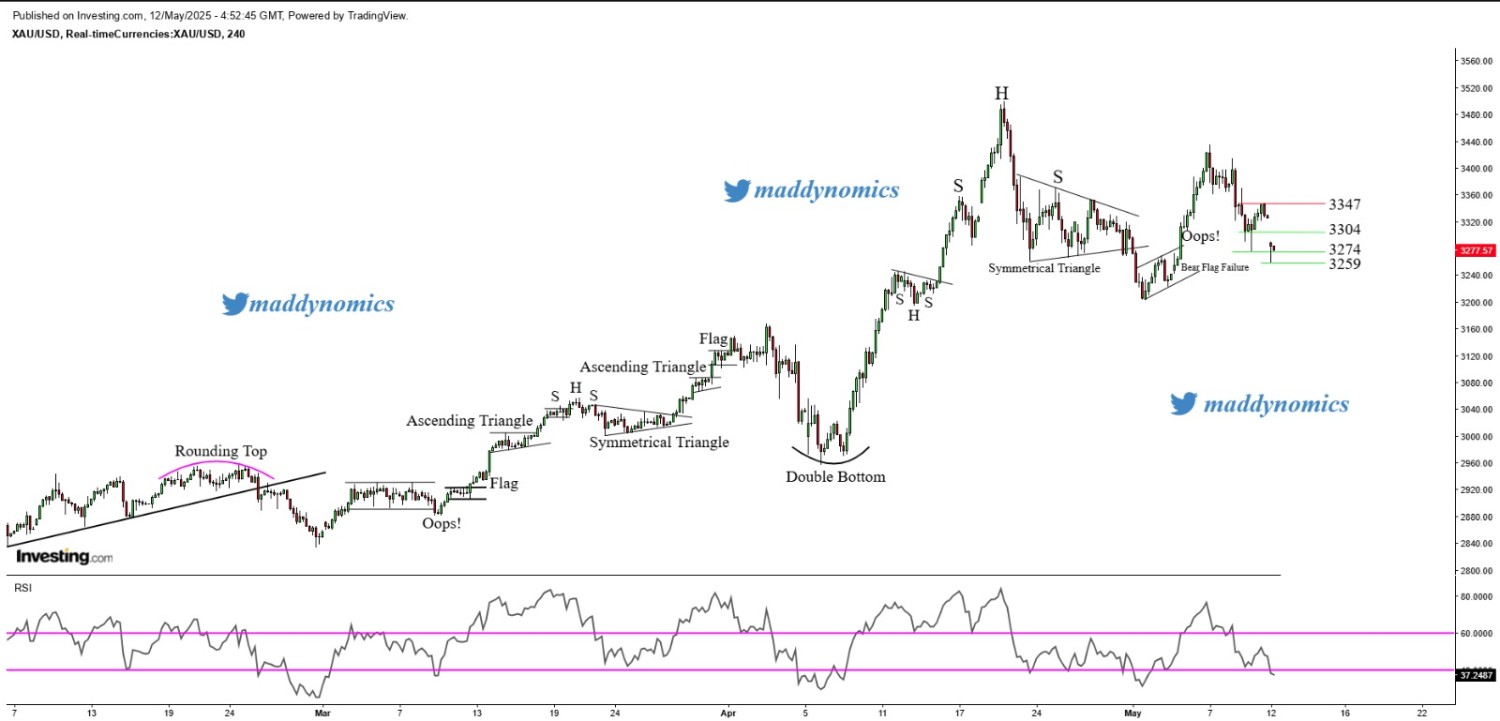
Gold slipped on constructive US- China t...
May 12, 2025
Market Insights
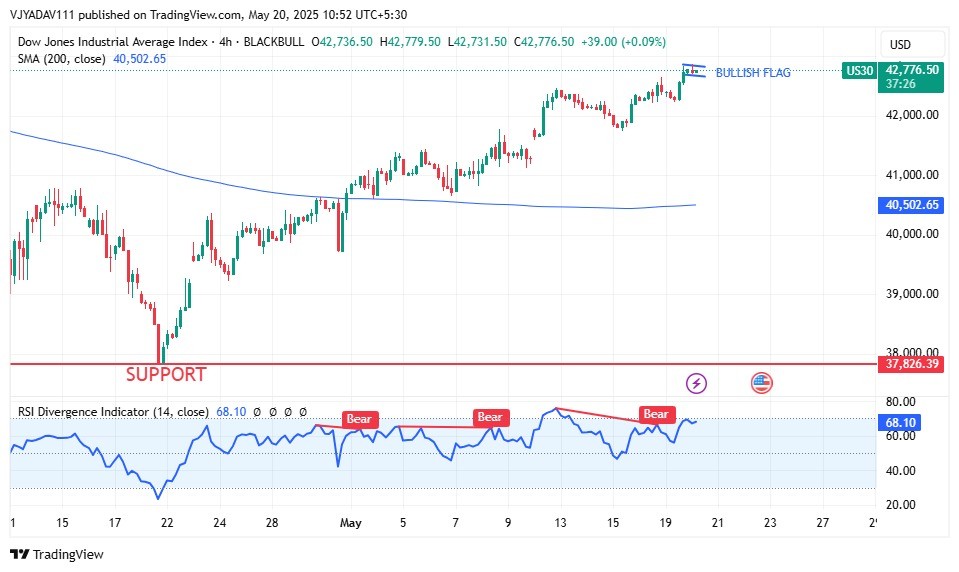
Dow Jones Breaks Out of Bullish Flag For...
May 20, 2025
Market Insights


