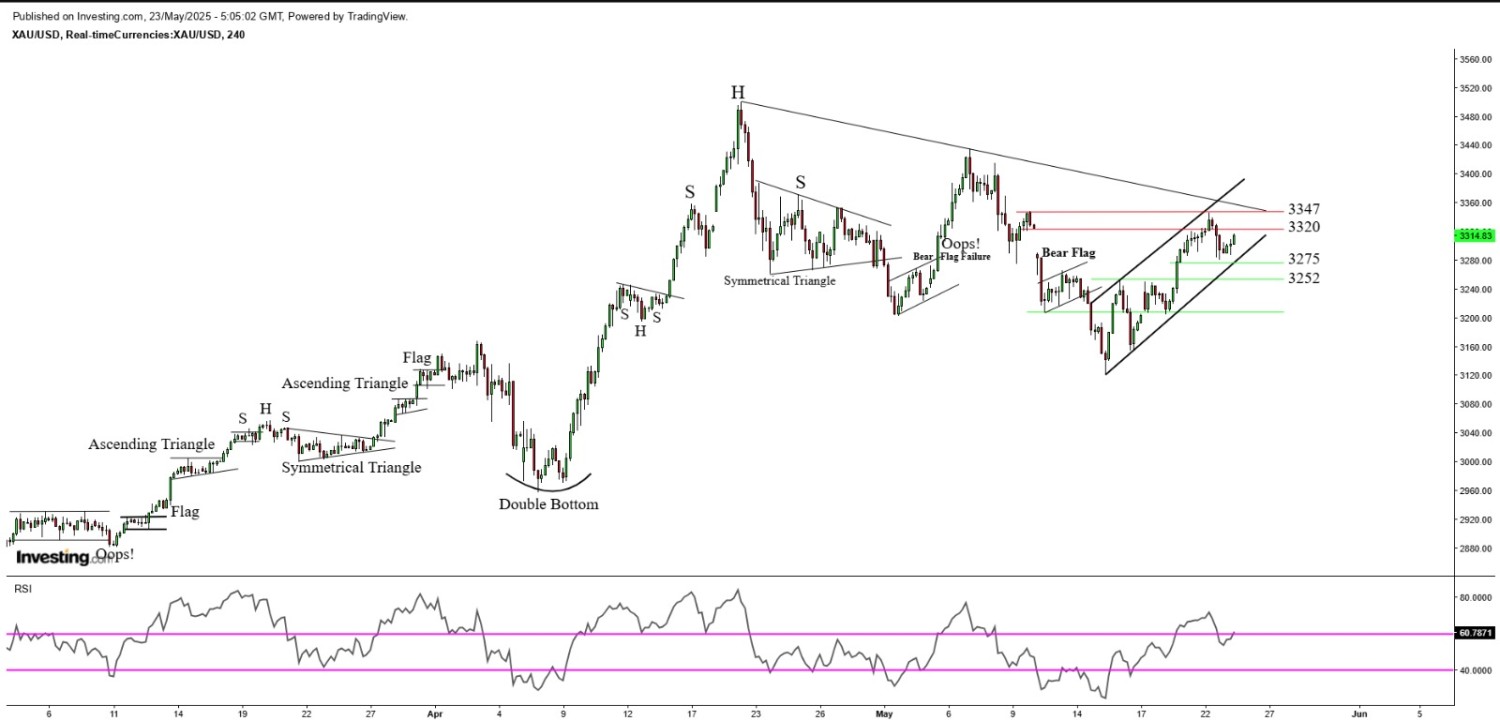
Symmetrical Triangle on Gold's chart indicating neutrality in the price movement
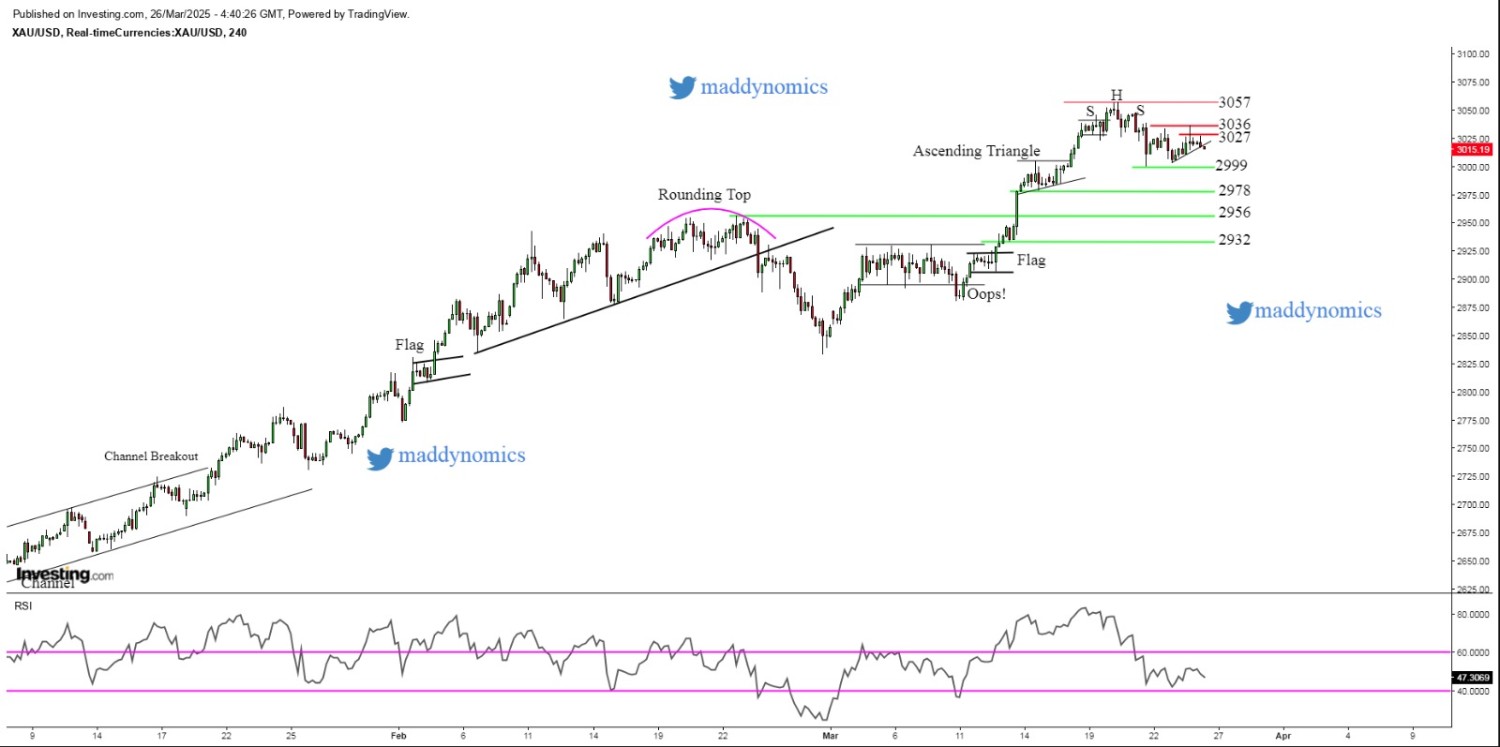
Despite comfortably trading above the psychological level of $3000, upside potential seems restricted in Gold prices. On the other hand, Dollar Index shows signs of stability above 104.00 mark since three consecutive sessions. The Greenback trades with optimism as Fed chair reiterated that it is in no rush to cut down the interest rate amid uncertainties revolving around Trump's policies. Any hope of recovery in the US Dollar is exerting pressure on the Gold price.
The yellow metal consolidates within a symmetrical triangle on its hourly chart, suggesting that overall momentum remains neutral at the time of writing. A breakdown of this symmetrical triangle below $3013 might drag the prices lower towards $3007, $3000 and $2995.
Contrarily, a breakout on the upside, above $3037 might push the prices higher towards $3045, $3057 and $3070 level.
Gold Structure: Inverted Hammer on Daily, Taking Resistance on 8SMA on Daily, Lower Highs Lower Lows on 4hr.
Intraday Strategy/ Intraday Trend: Sell on Rise, Sell on Break of Supports/Bearish
Major Resistance: 3027, 3036, 3046
Major Support: 3013, 3007, 3002
Recent News
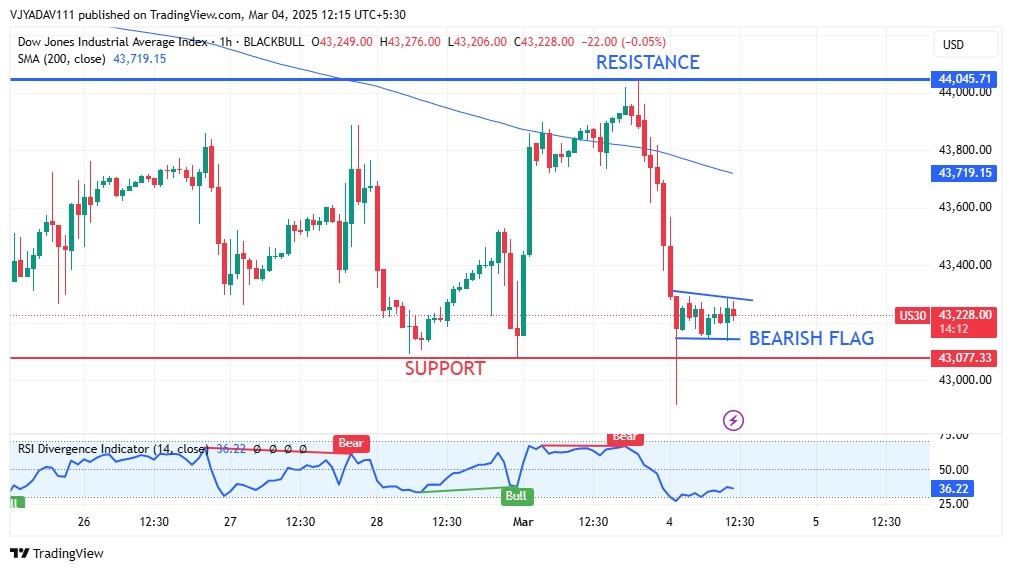
Dow Jones Forms Bearish Flag Eyes Suppor...
March 04, 2025
Market Insights
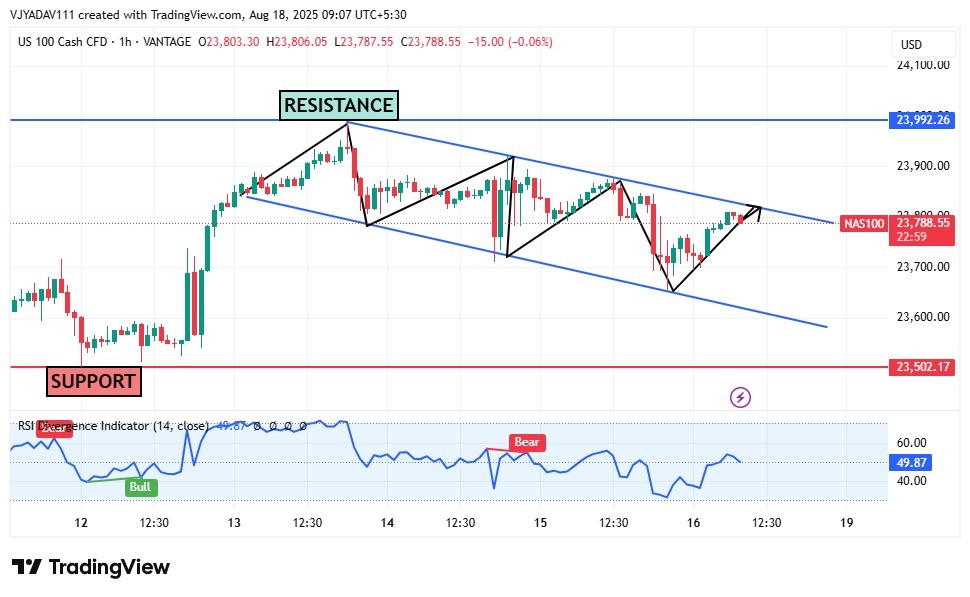
NASDAQ 100 Trades Within Descending Chan...
August 18, 2025
Market Insights
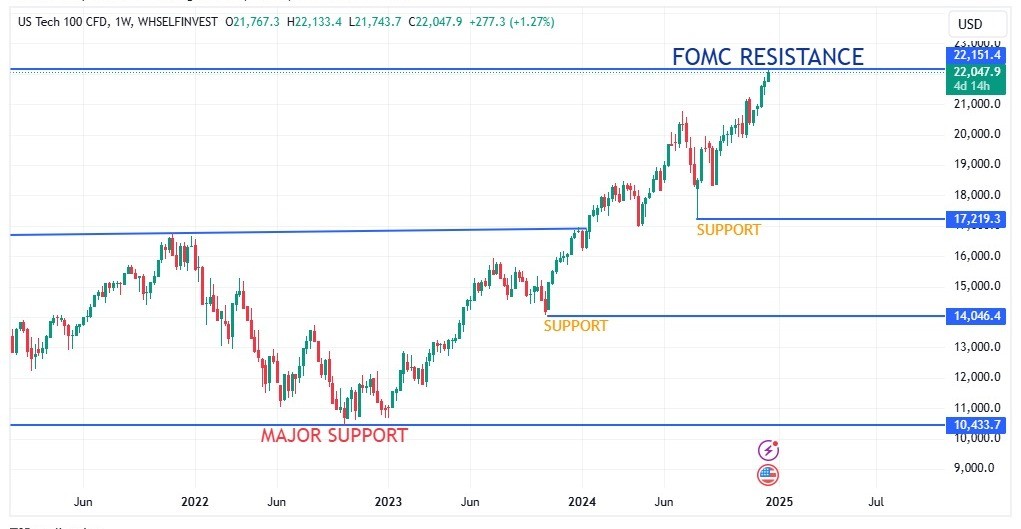
NASDAQ making new ATH
December 18, 2024
Market Insights
Gold holds firm near two-week high amid...
May 23, 2025
Market Insights
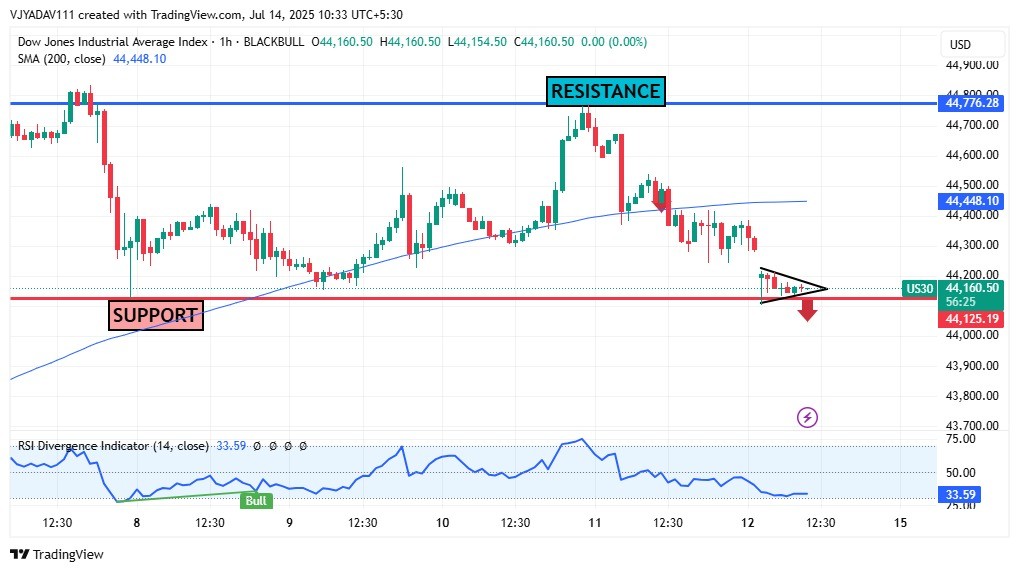
US30 Forms Bearish Pennant at Key Suppor...
July 14, 2025
Market Insights
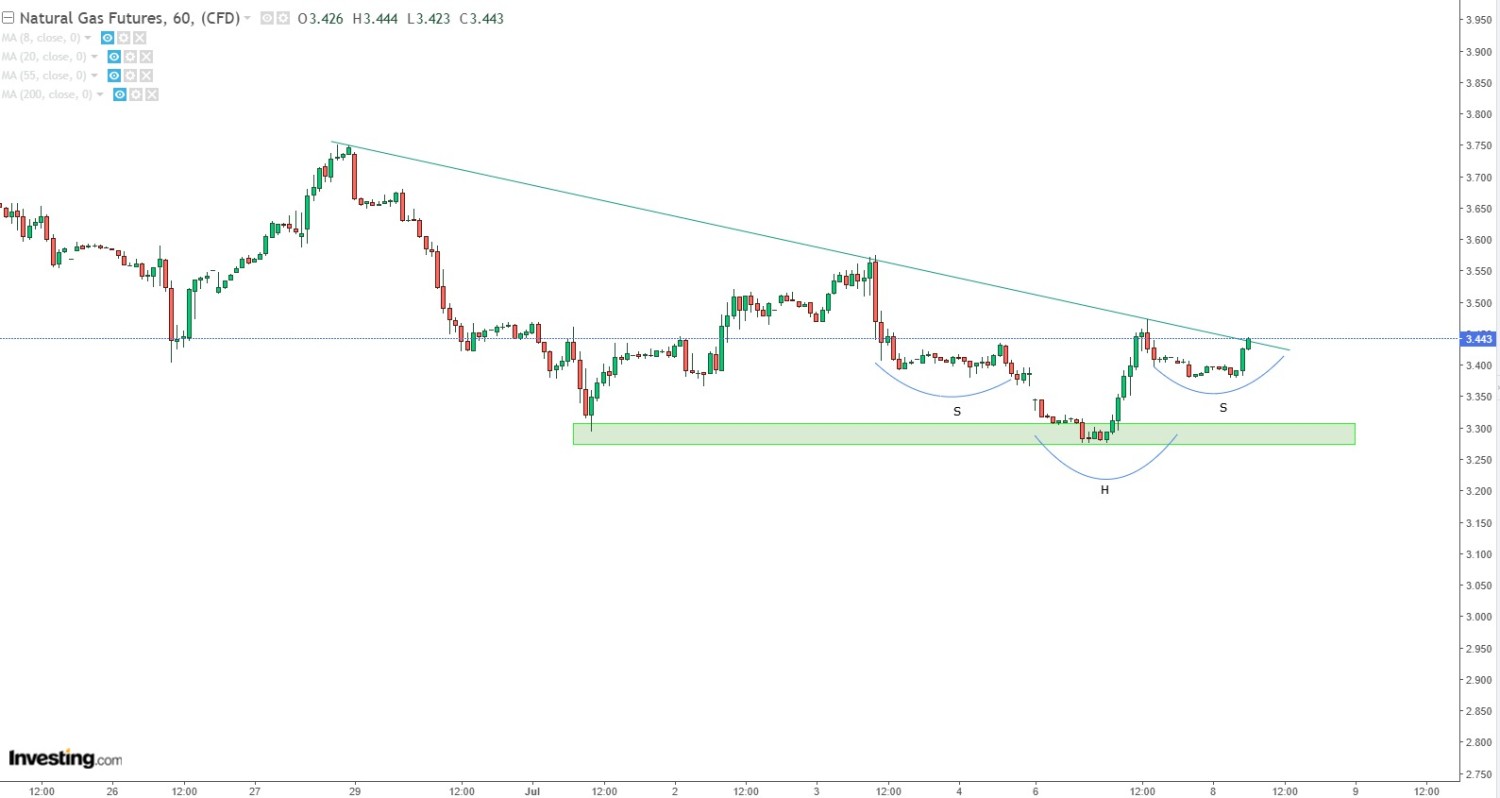
Bullish technical setup emerges in Natur...
July 08, 2025
Market Insights


