Gold extends losses for the third consecutive session following some profit-taking
Gold prices rebounded from a three week low near $2972 after facing some selling pressure below $3000 on Monday's trading session. The mild recovery was attributed to People's Bank of China adding to its gold reserves for the fifth month in a row.
However, the gains didn’t last long as investors sold gold to offset losses from a global stock market sell-off. Market analysts warn of a similar 'bloodbath' in financial market that took place in 1987 as Black Monday.
Meanwhile, strong U.S. jobs data released on Friday and hawkish comments from Fed Chair Powell kept the U.S. Dollar firm, limiting gold’s upside. Still, expectations of future Fed rate cuts are helping gold stay firm above the $3,000 level.
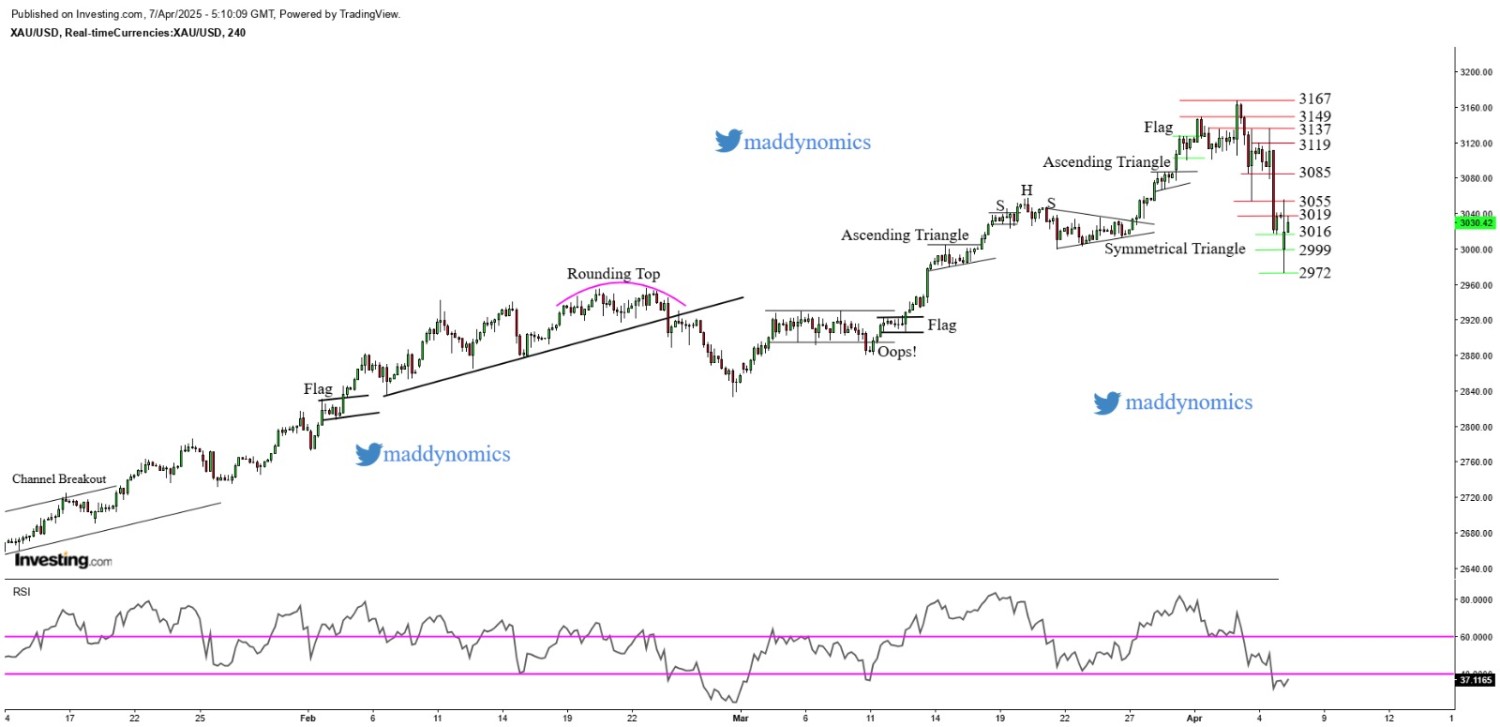
XAU/USD TECHNICAL OUTLOOK
On the weekly chart of Gold, a Shooting Star candlestick pattern has emerged, indicating potential bearish reversal. The daily chart shows a breakdown of a High Wave candle, reflecting market confusion turning into bearish pressure. Meanwhile, the 4-hour chart showcases formation of a Bearish Flag suggesting further downside.
Intraday Trend & Strategy: The intraday bias remains neutral to bearish, favouring a buy-on-supports and sell-on-resistance approach as price action remains choppy.
Weekly Trend: Neutral
Key Levels to Watch:
-
Resistance: 3039, 3055, 3067
-
Support: 3017, 2999, 2872
Recent News
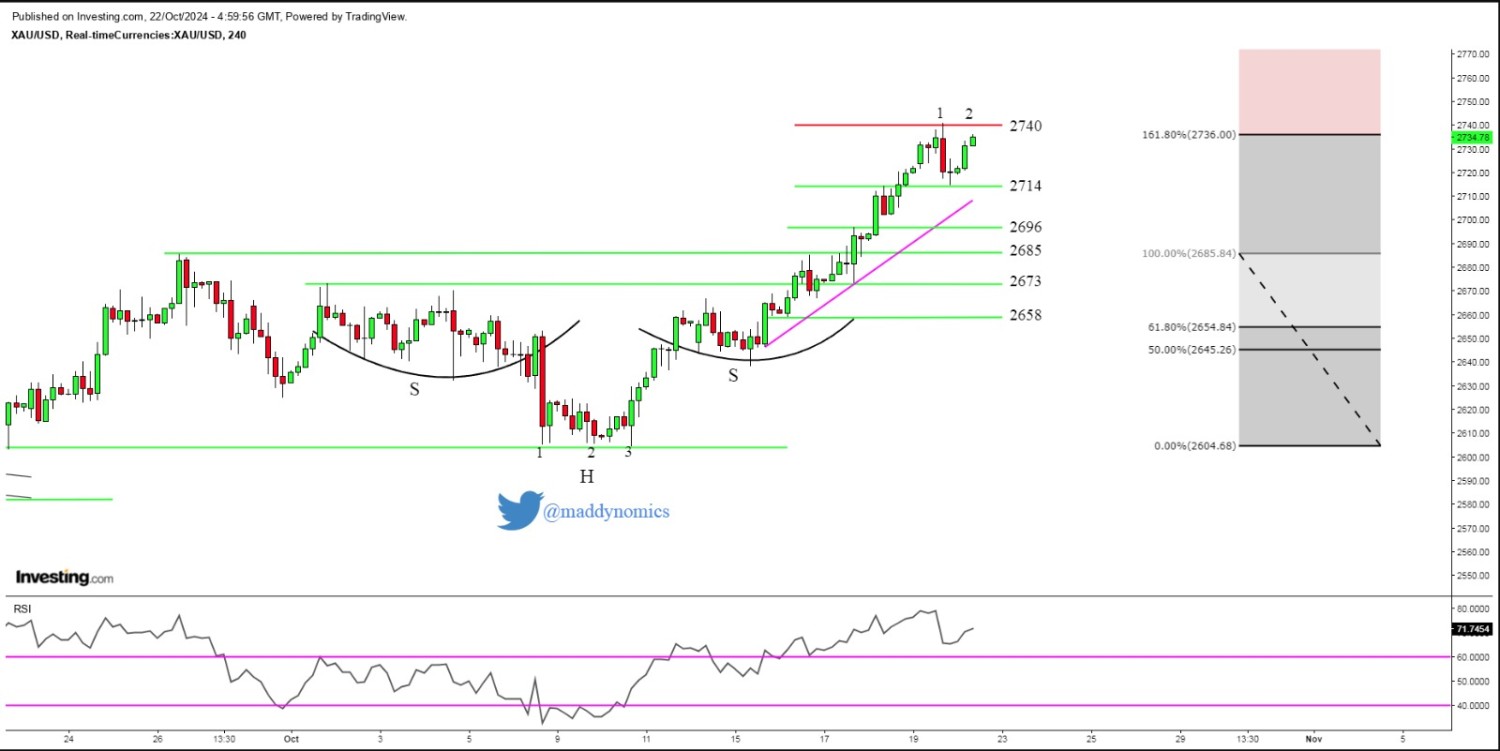
Gold may halt rally after 8 Days of Buyi...
October 22, 2024
Market Insights
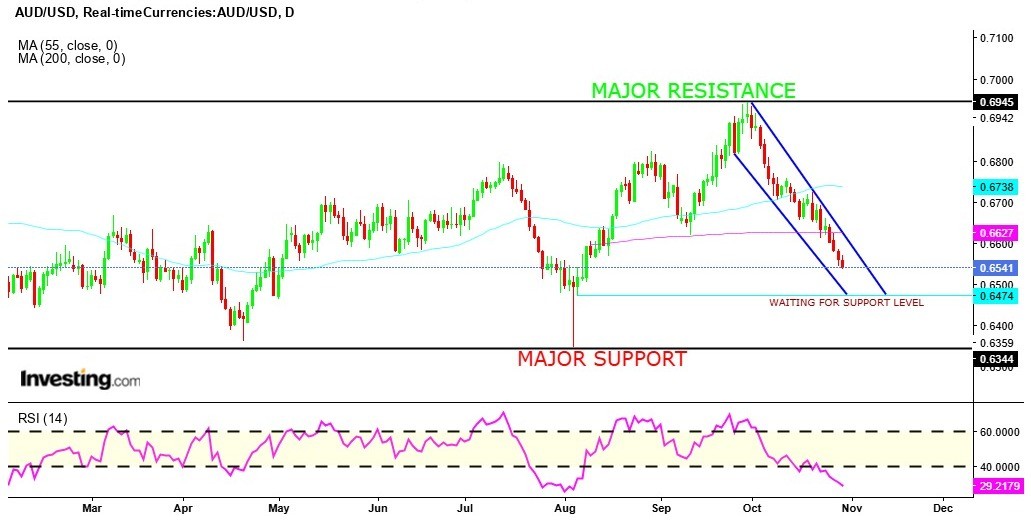
AUD/USD eyes key daily support, setting...
October 30, 2024
Market Insights
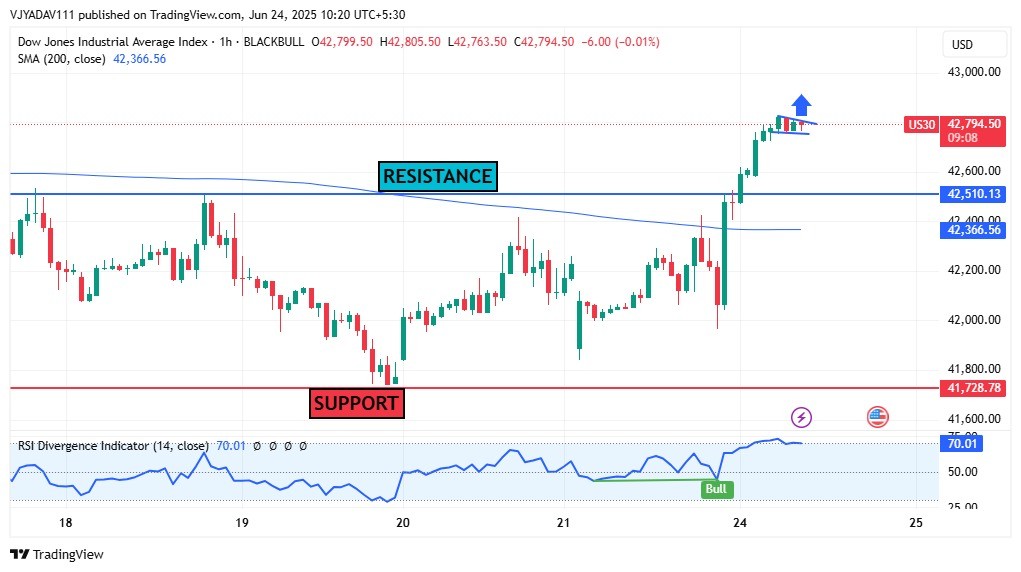
US30 Breaks Resistance Bullish Momentum...
June 24, 2025
Market Insights
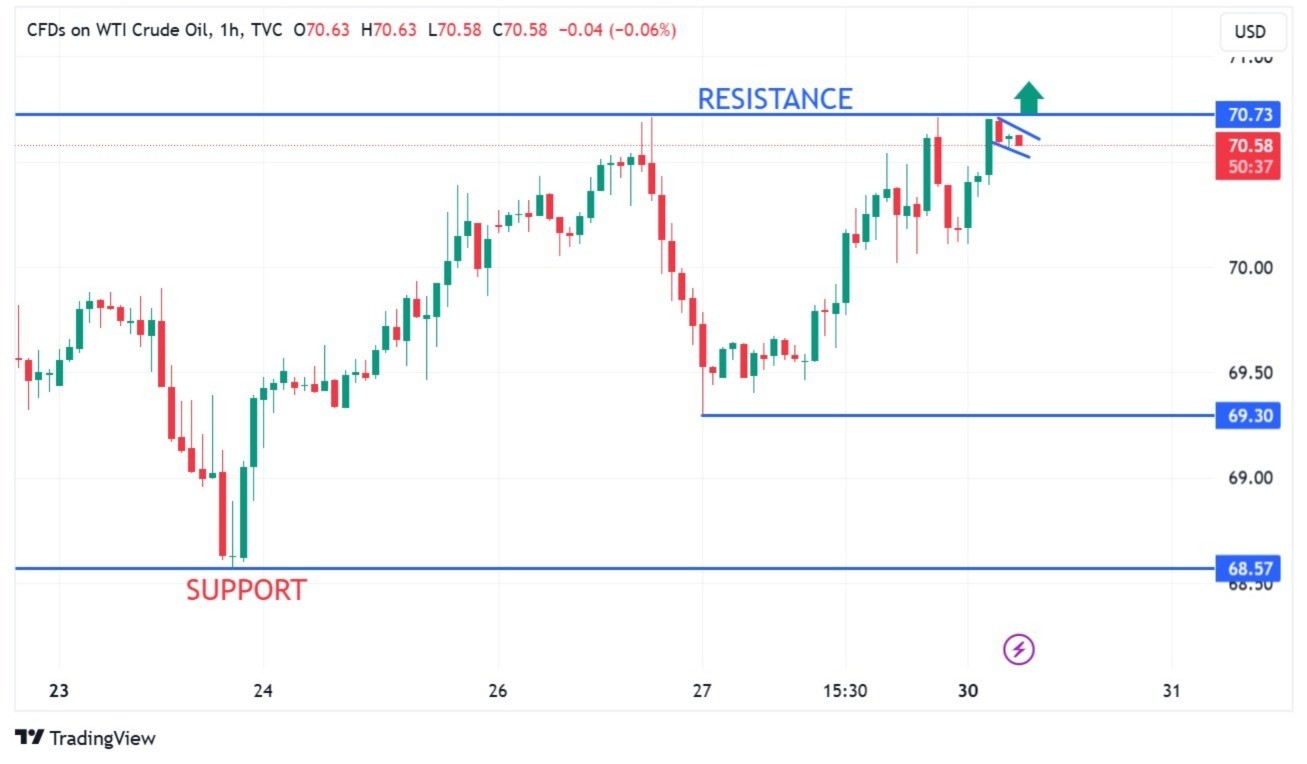
CRUDE OIL facing Daily Resistance
December 30, 2024
Market Insights
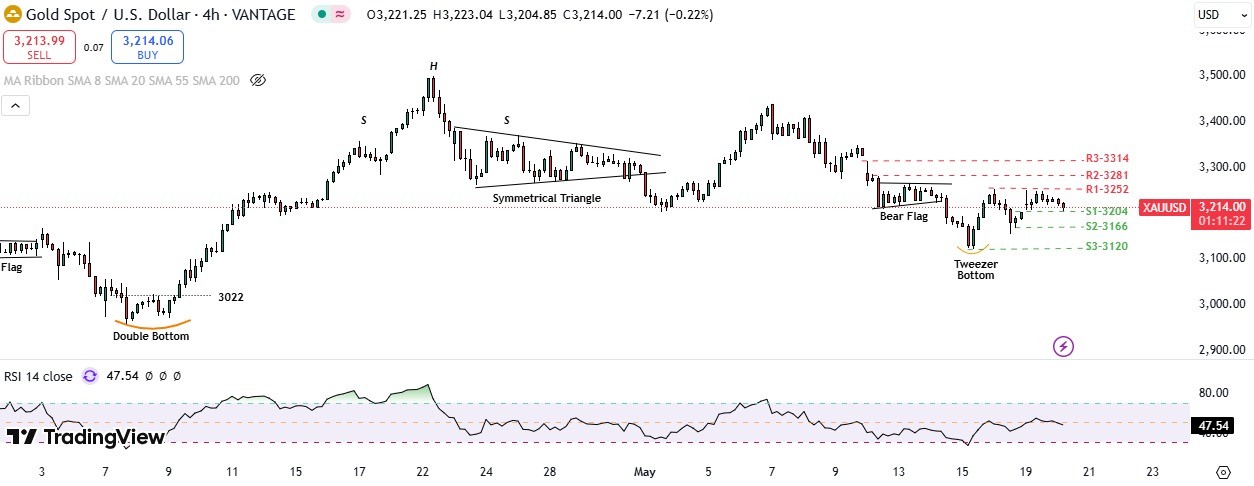
Gold drifted lower on growing optimism f...
May 20, 2025
Market Insights
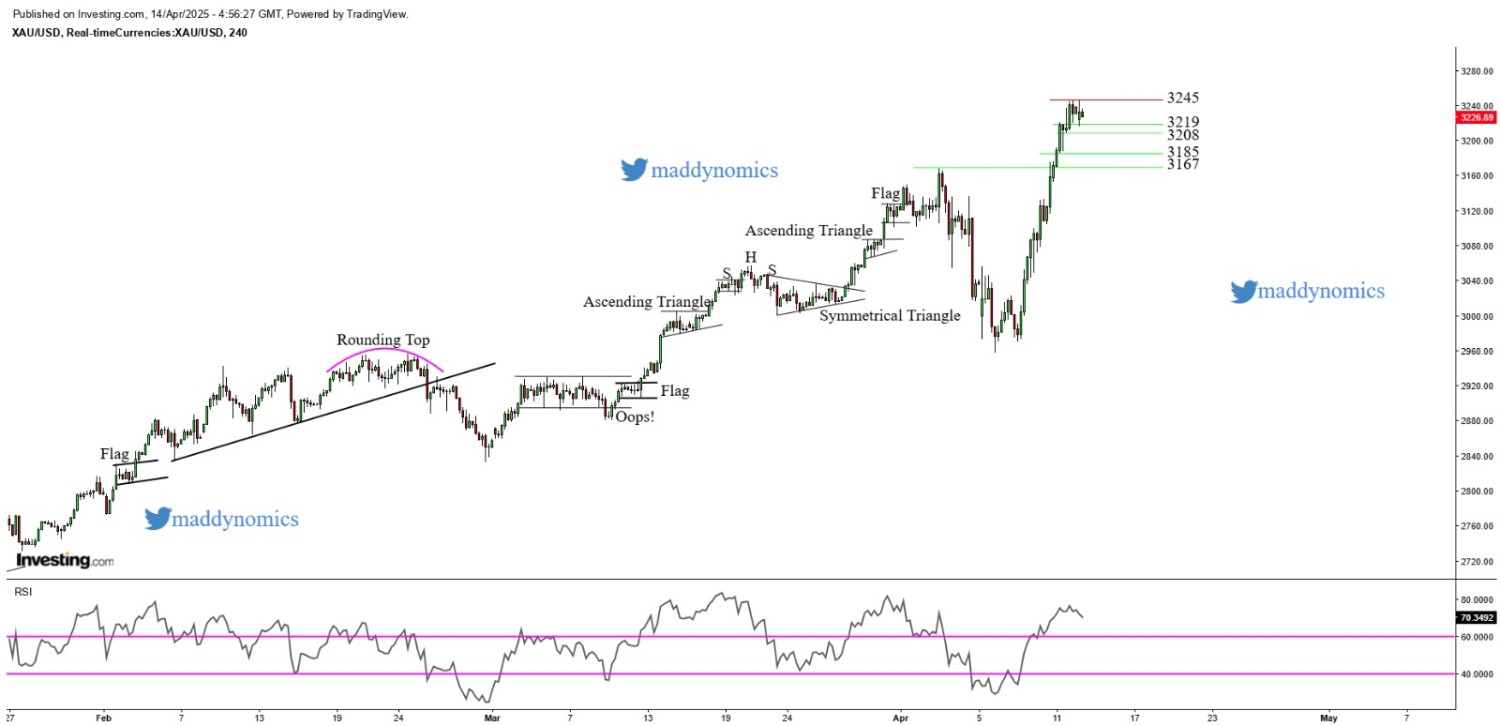
Gold price retreats from record highs as...
April 14, 2025
Market Insights


