Natural Gas Daily Chart – Cup and Handle Pattern
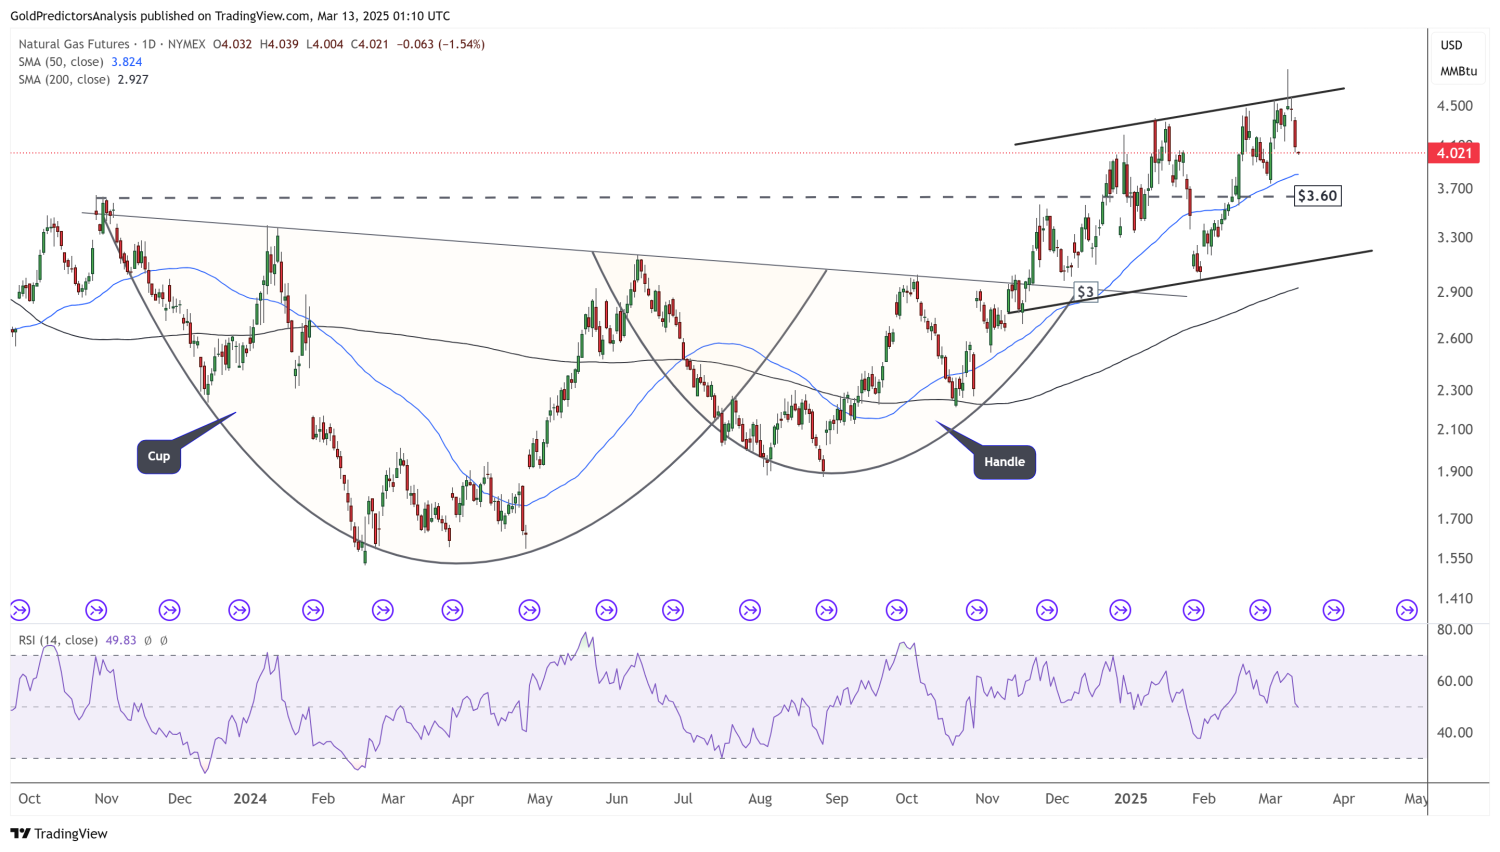
The daily chart of Natural Gas (NG) suggests a classic cup and handle formation, a bullish continuation pattern indicating further upside potential. The price recently hit resistance and pulled back, forming the "handle" phase.
- Support: Holding above $3 is crucial for sustaining the pattern.
- Breakout Zone: A decisive move above $5 would confirm the breakout, opening doors for further gains.
- Trend Outlook: As long as NG remains above $3, the broader trend favors bulls.
Recent News
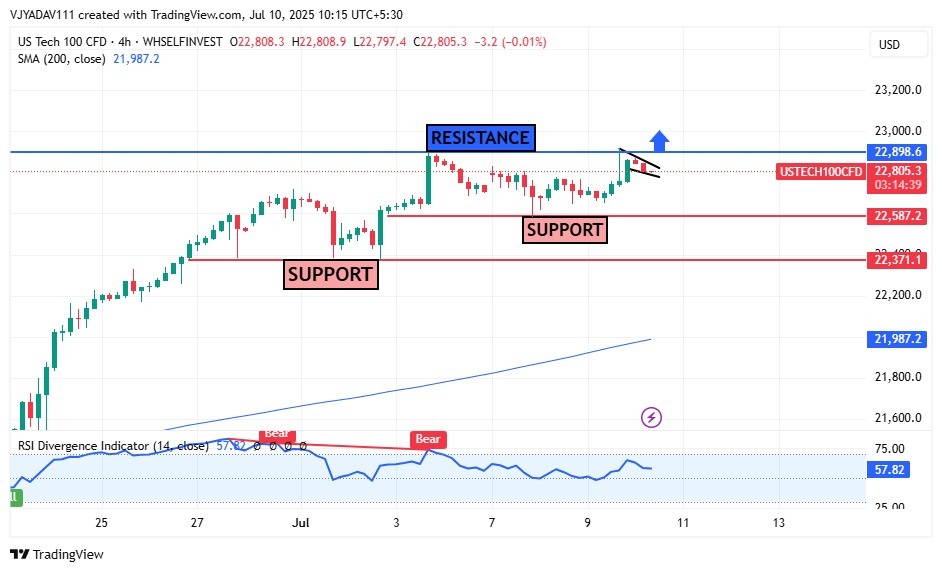
US Tech 100 Consolidates Below Resistanc...
July 10, 2025
Market Insights
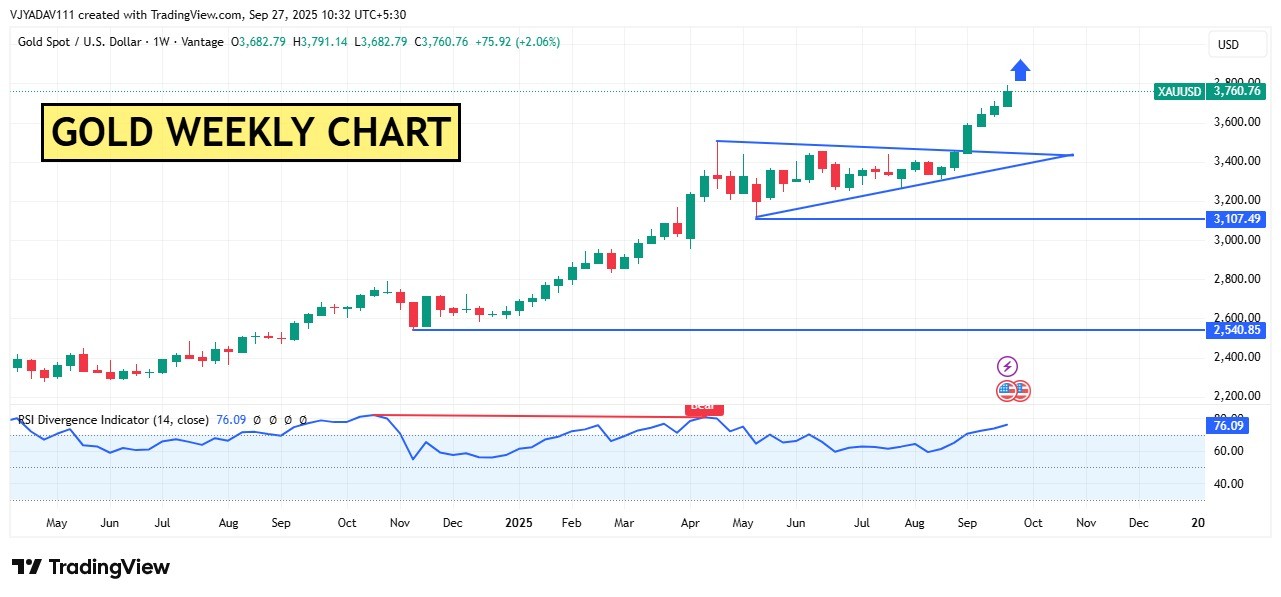
Gold Weekly Chart: Breakout Rally Pushes...
September 27, 2025
Market Insights
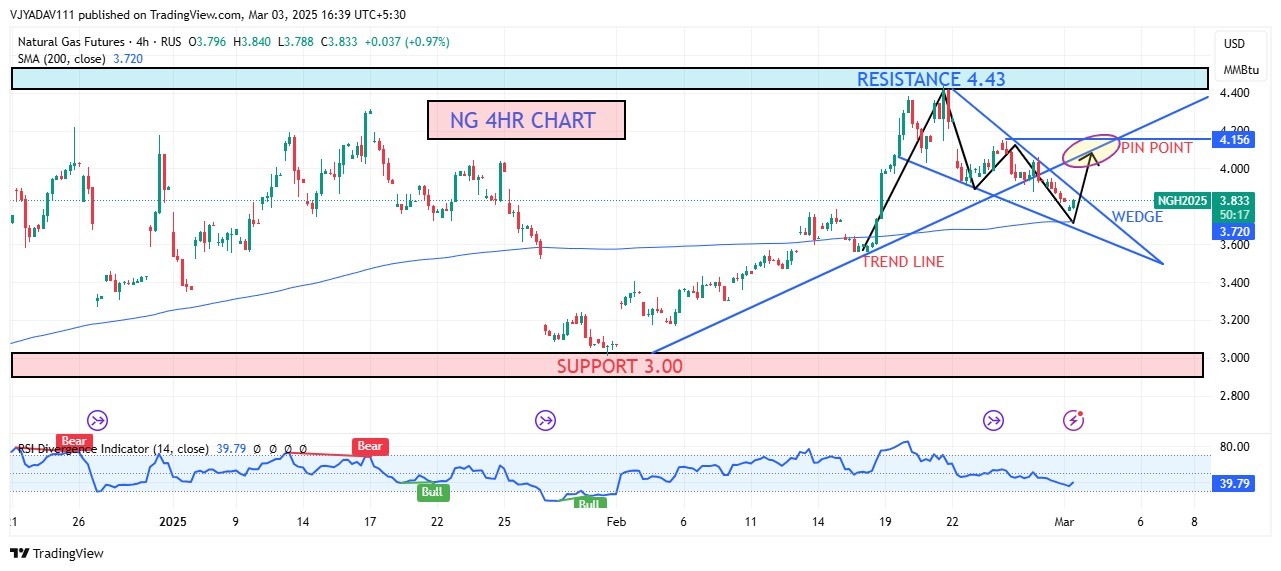
Natural Gas 4 Hour Chart Pinpointing the...
March 03, 2025
Market Insights
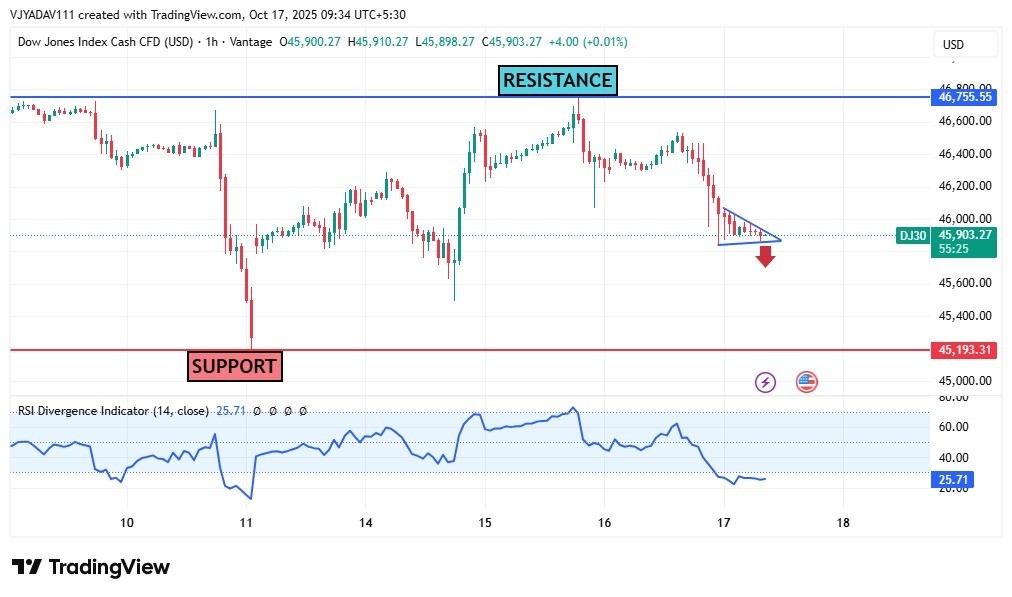
DOW JONES sustaining on lower levels wit...
October 17, 2025
Market Insights
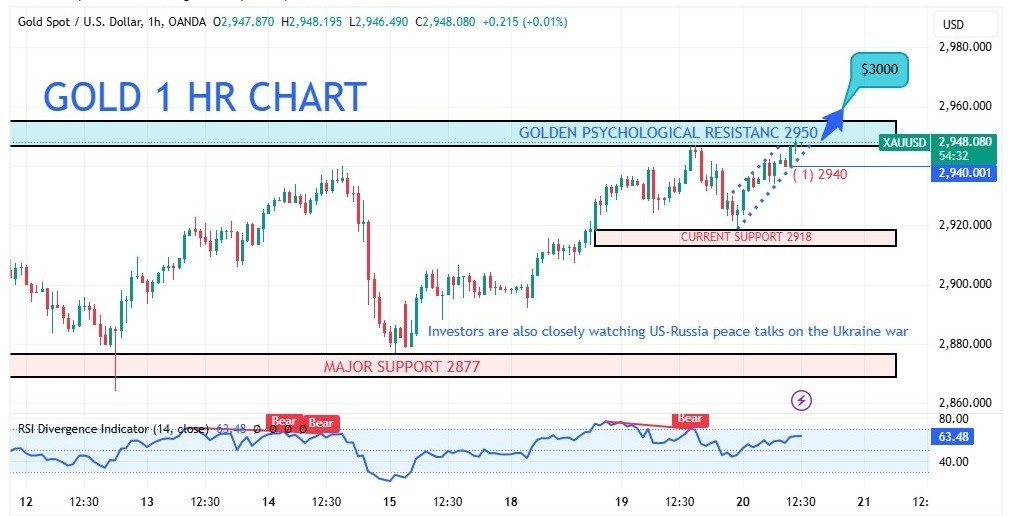
Gold Steadies Above $2,942 as FOMC Minut...
February 20, 2025
Market Insights
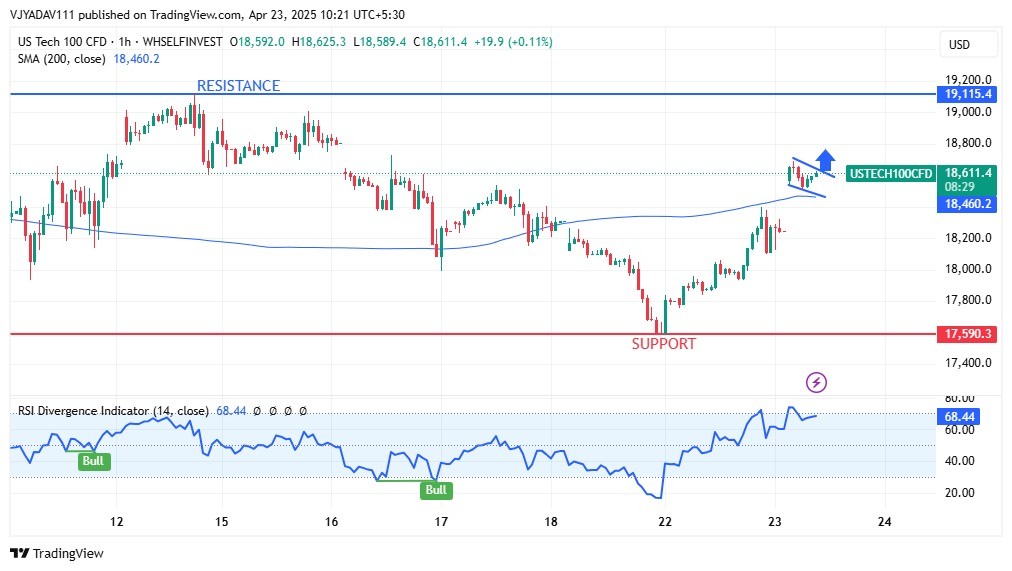
US Tech 100 Rockets Higher Breaking Barr...
April 23, 2025
Market Insights


