Gold struggles to extend its recovery beyond the 200-period SMA on 4-Hour
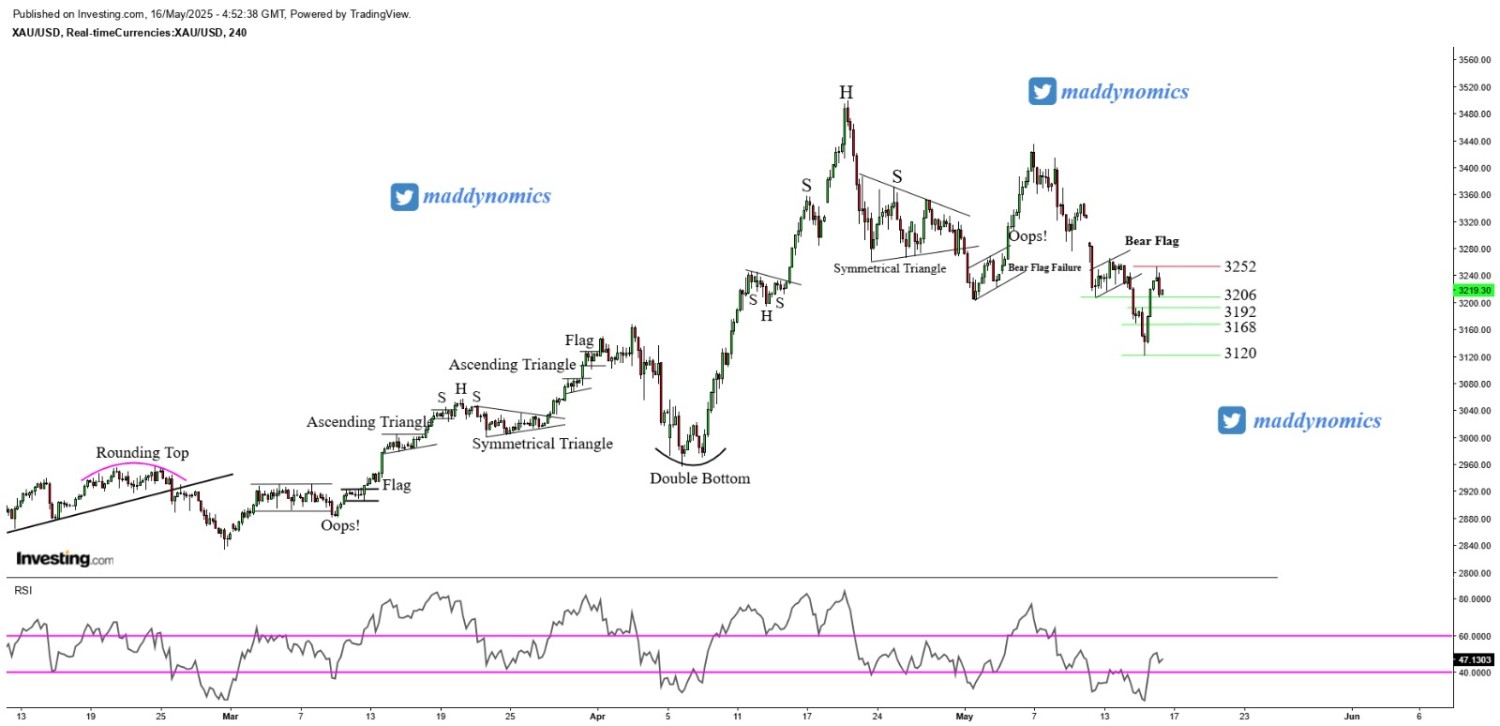
Gold prices faced renewed selling pressure in Friday’s Asian session, struggling to extend the previous day’s strong rebound from the $3,120 region, its lowest level since April 10. While optimism over the 90-day US-China trade truce has eased recession fears, weighing on safe-haven demand, a mix of supportive factors may still help limit deeper losses for the precious metal. The US and China have agreed to lower tariffs and implement a 90-day pause to negotiate a broader trade agreement, marking a significant step toward easing tensions between the world's two largest economies. Meanwhile, US President Trump indicated that talks are also underway with other key trading partners, including India, Japan, and South Korea.
During his May 15, 2025, speech at the Second Thomas Laubach Research Conference, Federal Reserve Chair Jerome Powell emphasized the need to reassess the Fed's monetary policy framework in light of recent economic developments. He emphasized that the U.S. economy might be entering an era of more frequent and persistent supply shocks, driven by factors like tariffs, pandemics, and climate change. He suggested that the Fed's current monetary policy framework, which has prioritized low unemployment even at the cost of higher inflation since 2020, may no longer be suitable in this environment. Powell indicated that the Federal Open Market Committee (FOMC) is actively reviewing its strategy to better balance inflation control and economic growth while enhancing communication to reduce policy uncertainty.
XAU/USD TECHNICAL OVERVIEW
Technical Structure: Gold maintains a broadly bullish structure, as reflected by a Bullish Piercing Candle on the Daily chart, signaling potential upside momentum. The metal has recently rebounded from 55-DSMA, indicating strong underlying support. However, it currently faces resistance at the 200-period SMA on the 4-Hour chart, highlighting a critical decision point for the short term trend. On the 15-minute chart, a Rising Wedge pattern is emerging, which typically suggests a near-term pullback.
Intraday Trend/ Intraday Strategy: The intraday trend remains Neutral to Bullish and favours the approach of buying on significant support levels and selling near resistance zones
Weekly Trend: Bullish
Major Support: 3213, 3206, 3196
Major Resistance: 3227, 3243, 3252
Recent News
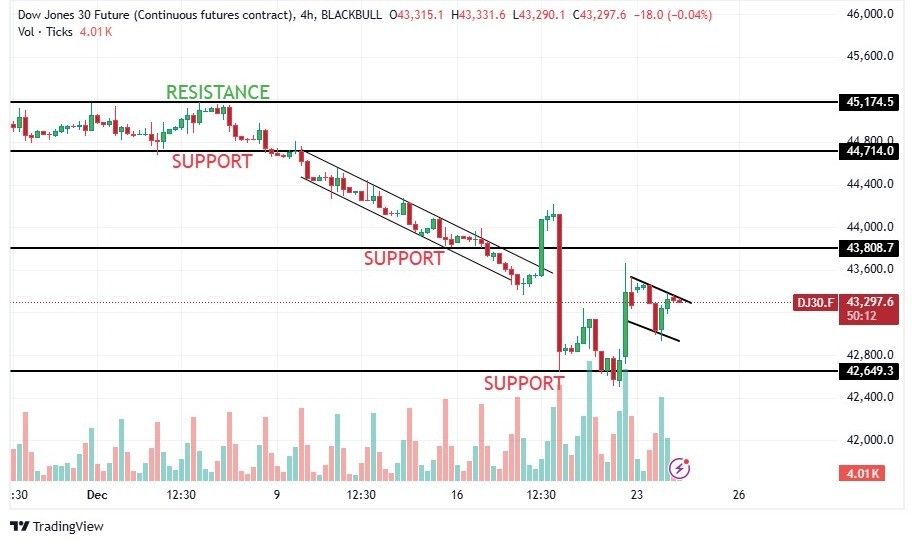
The Dow Jones is fighting to regain its...
December 24, 2024
Live Charts
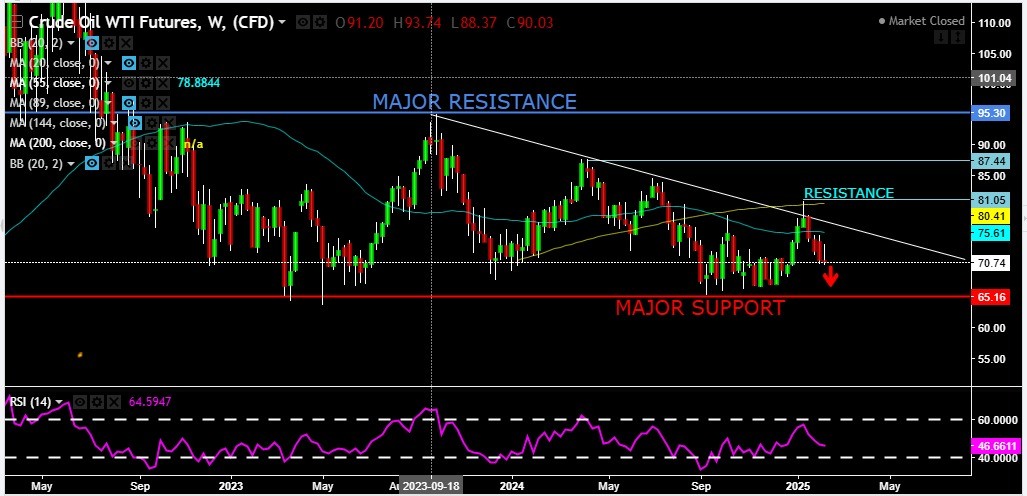
CRUDE OIL Sustaining on lower levels.
February 15, 2025
Market Insights
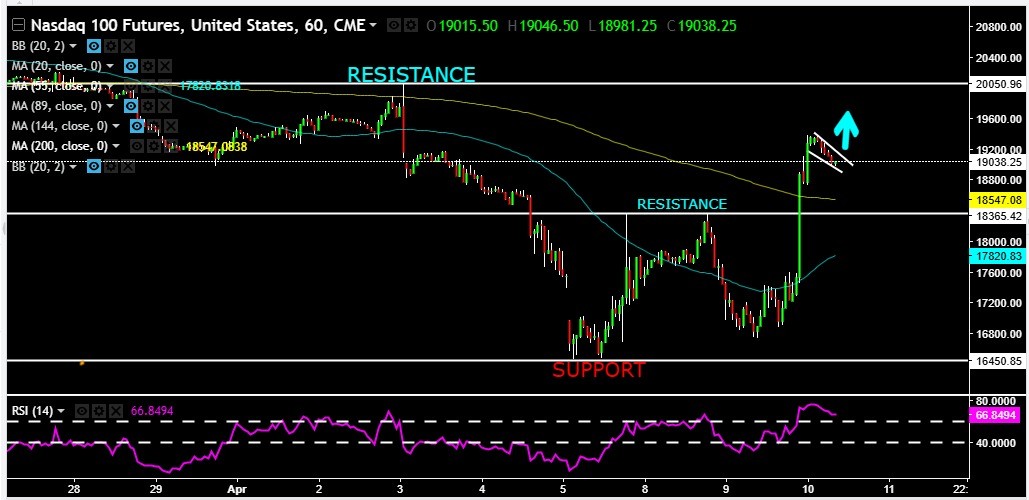
Dow Jones Futures Bullish Triangle Break...
April 11, 2025
Market Insights
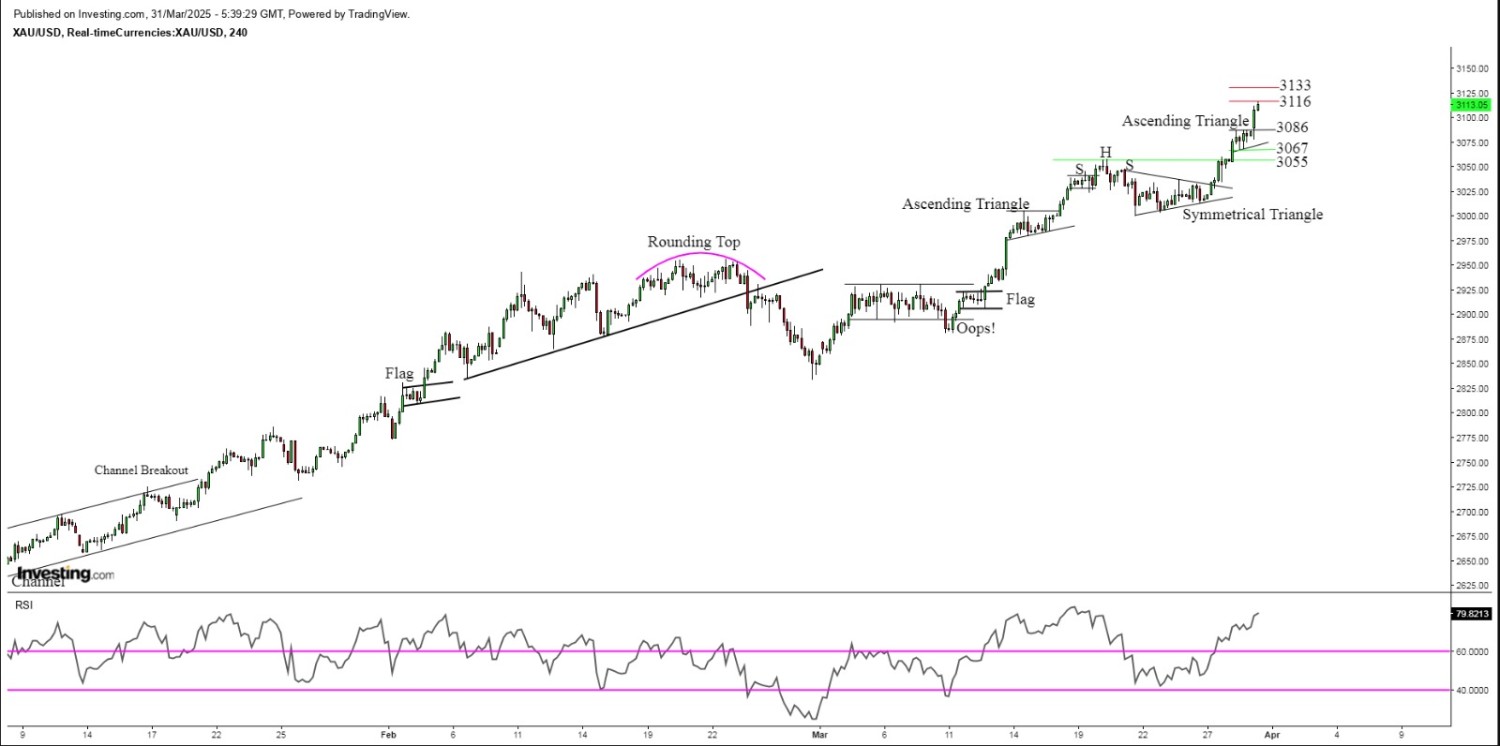
Gold achieves a new record high of $3128...
March 31, 2025
Market Insights
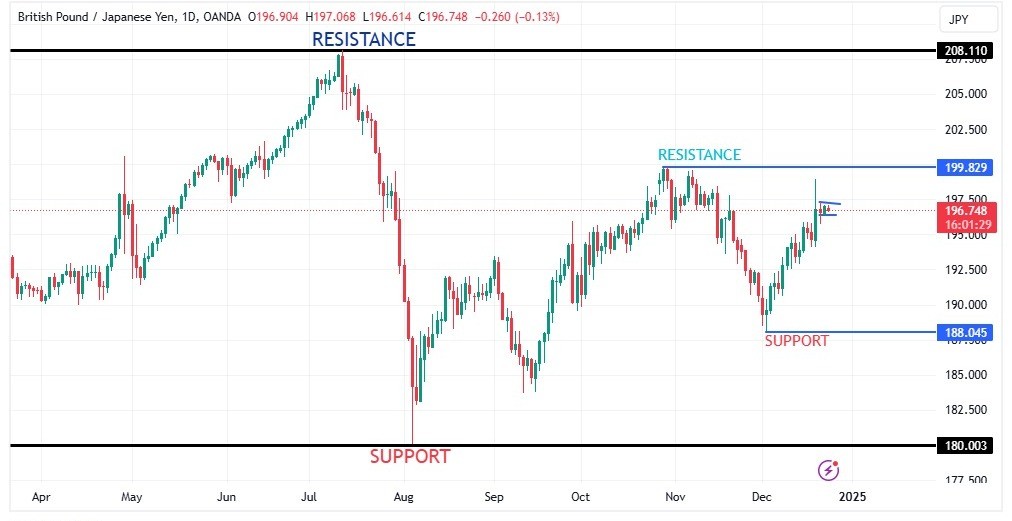
GBPJPY making a bullish flag on Daily ti...
December 24, 2024
Market Insights
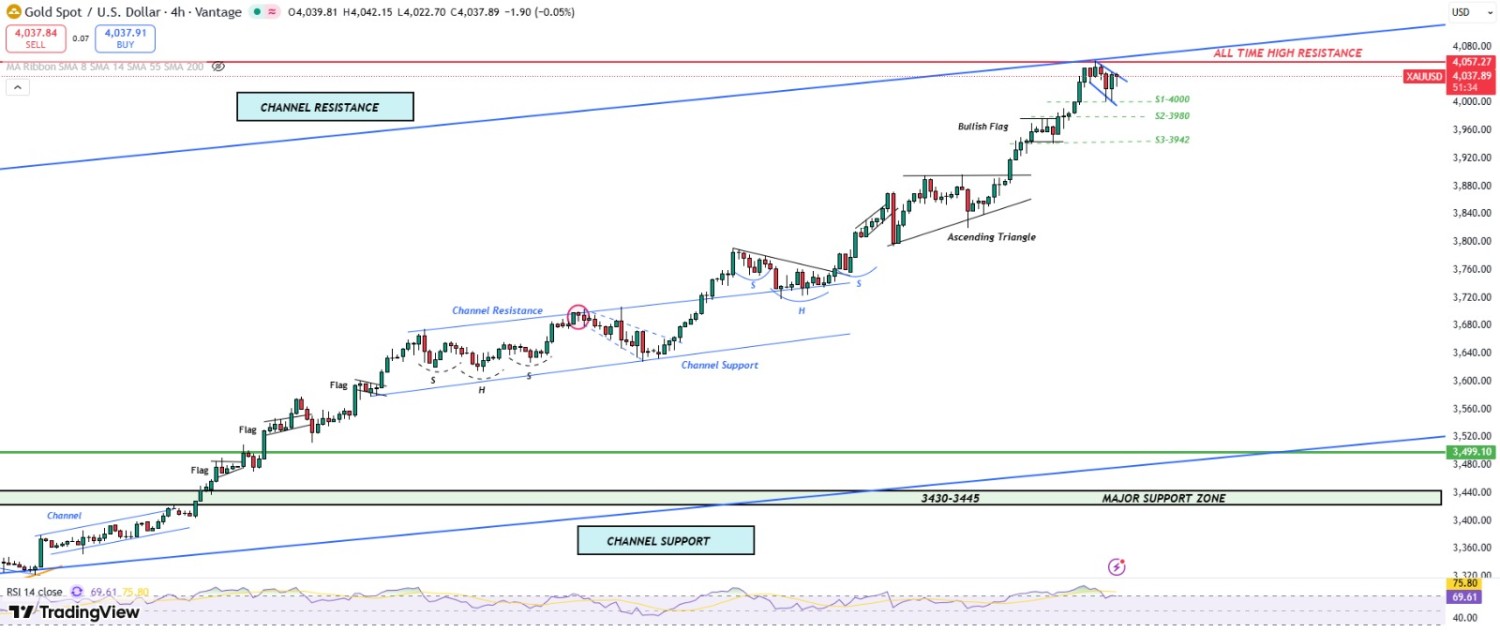
Gold eyes $4,000 as negative bias persis...
October 09, 2025
Market Insights


