Gold holds steady near multi-week highs as Israel-Iran tensions escalate
Israel confirmed earlier that it had struck Iranian nuclear targets to prevent Tehran from developing atomic weapons. In response, Iranian media reports suggest that Iran may soon declare war and retaliate, with military officials warning that Israel and the U.S. will "pay a very heavy price." U.S. President Donald Trump has convened a National Security Council meeting for 15:00 GMT.
Amid rising geopolitical tensions, investors have rushed to traditional safe-haven assets, including Gold, U.S. Treasury bonds, and the Japanese Yen, seeking protection against market uncertainty and potential escalation in the Middle East.
Gold prices have surged for the third straight day, trading at seven-week highs, fueled by both geopolitical risk and growing expectations of U.S. Fed rate cuts. If Iran launches a harsh response to Israel’s strike on the Natanz facility, gold could target the $3,500 record high.
XAU/USD TECHNICAL OVERVIEW
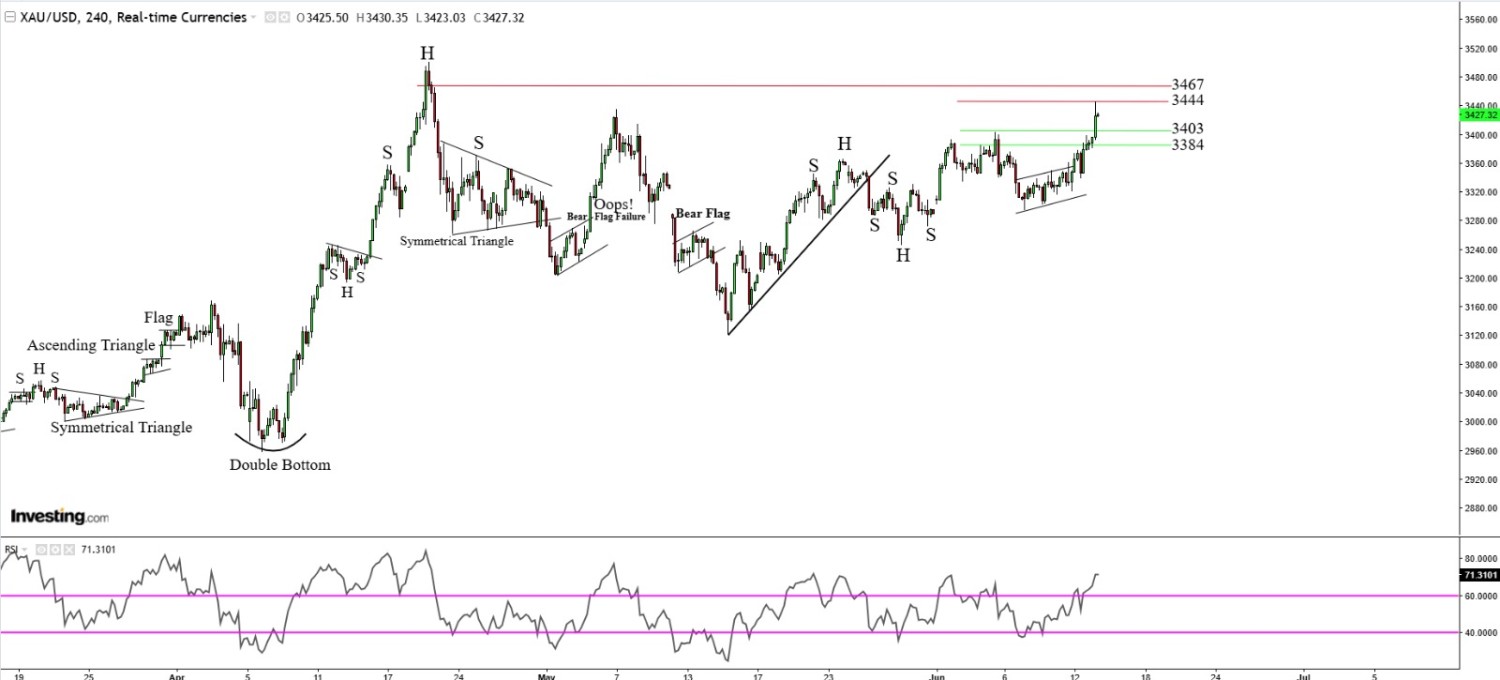
Technical Structure: Gold continues to exhibit strong bullish momentum amid intensifying geopolitical tensions. On the daily chart, the metal has confirmed a range breakout, signaling the continuation of its broader uptrend. The 4-hour chart displays a strong bullish impulse candle, largely driven by safe-haven demand following the Middle East conflict escalation. However, short-term indicators suggest caution. A Tweezer Top pattern has formed on the 1-hour chart, hinting at potential intraday consolidation or minor pullback. On the 15-minute timeframe, a bear flag is visible, which could signal a brief pause before the next upward leg.
Intraday Trend/ Intraday Strategy: The intraday bias remains bullish and favours the strategy of Buying on Breakouts and Buying on Support
Weekly Trend: Bullish
Major Support: 3424, 3417, 3403
Major Resistance: 3430, 3444, 3468
Recent News
After a parabolic move in Gold, Its time...
February 11, 2025
Market Insights
DOW JONES ANALYISIS
November 05, 2024
Market Insights
Nasdaq 100 Holds Above 23,600 — Bullish...
August 29, 2025
Market Insights
Dow Jones Holds Above 200 MA Support Eye...
August 06, 2025
Market Insights
Gold Soars to $3,085 Amid Trade Tensions...
March 29, 2025
Market Insights
Dow Jones Consolidates Near 45,000 After...
August 14, 2025
Market Insights
