Gold hits $3,360 on Fed cut bets with 1H Inverted Head & Shoulders breakout
Gold futures climbed 0.5% to $3,365 per ounce as U.S. inflation data reinforced expectations for a Federal Reserve rate cut in September. The July CPI met forecasts, while core inflation hit its highest level since early 2025. MUFG analysts noted that easing goods price pressures tempered concerns over tariff-driven inflation.
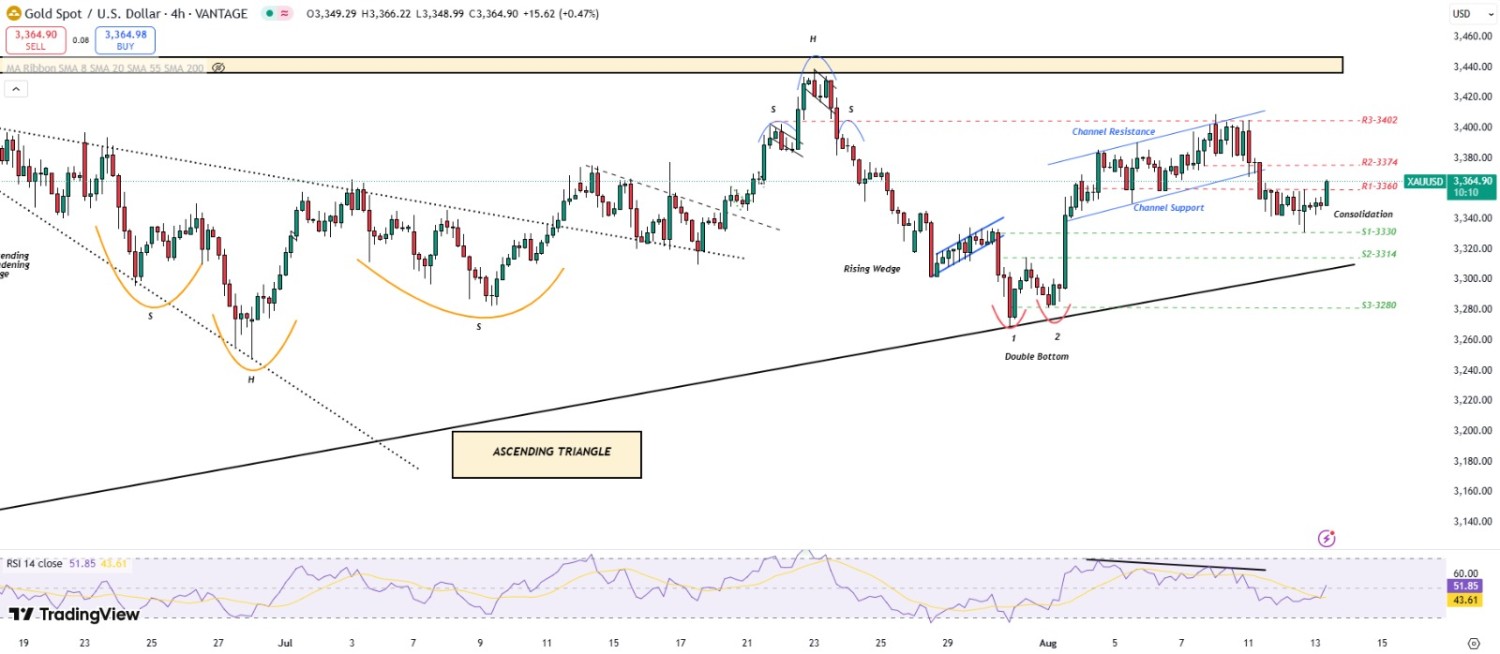
A softer labor market outlook has strengthened bets on monetary policy easing, boosting the appeal of non-yielding bullion. Lower interest rates generally support gold prices, and technical charts show a potential bullish setup with an inverted head & shoulders breakout on the 1H timeframe.
XAU/USD TECHNICAL OVERVIEW
Technical Structure: Gold’s technical structure is showing mixed signals across timeframes. On the daily chart, a Doji candle highlights indecision, with prices trading above the 20-SMA, reflecting upside momentum. The 4H chart shows a consolidation phase, while the 1H chart reveals a bullish inverted head & shoulders pattern, indicating potential for an upward breakout.
Weekly Trend: Neutral
Intraday Trend/ Intraday Strategy: The intraday bias shifts to bullish-to-neutral, favoring a buy on breakout or buy near support strategy.
Major Support: 3340, 3330, and 3314
Major Resistance: 3370, 3385, and 3402
Recent News
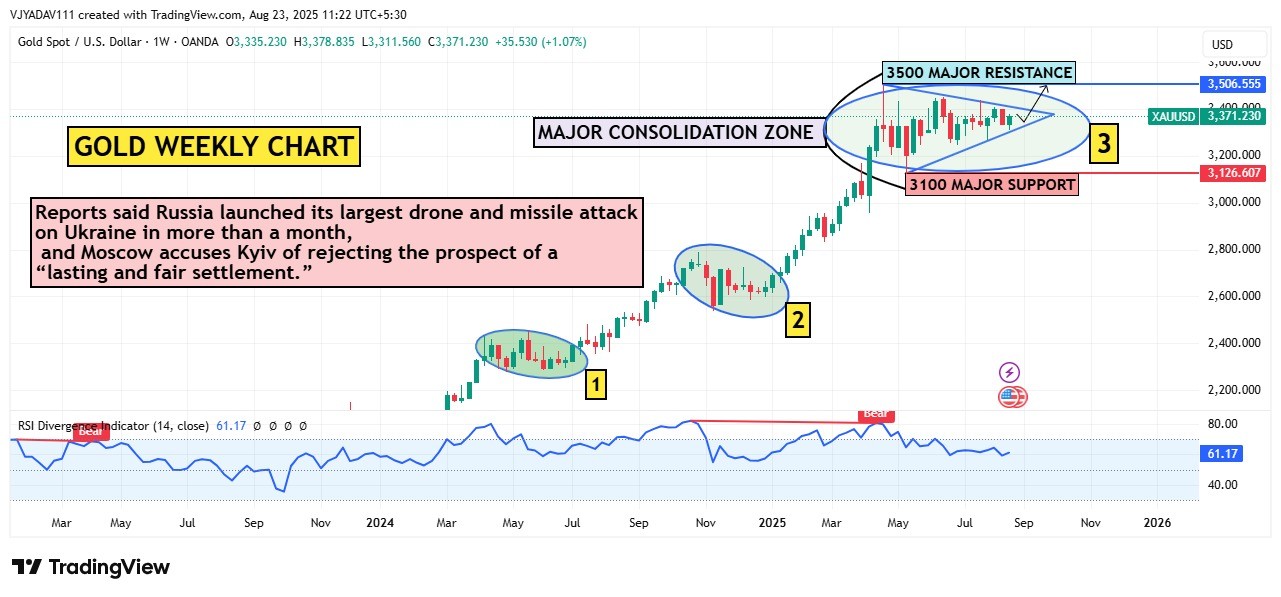
XAUUSD Stabilizes Between $3100–$3500 Ah...
August 23, 2025
Market Insights
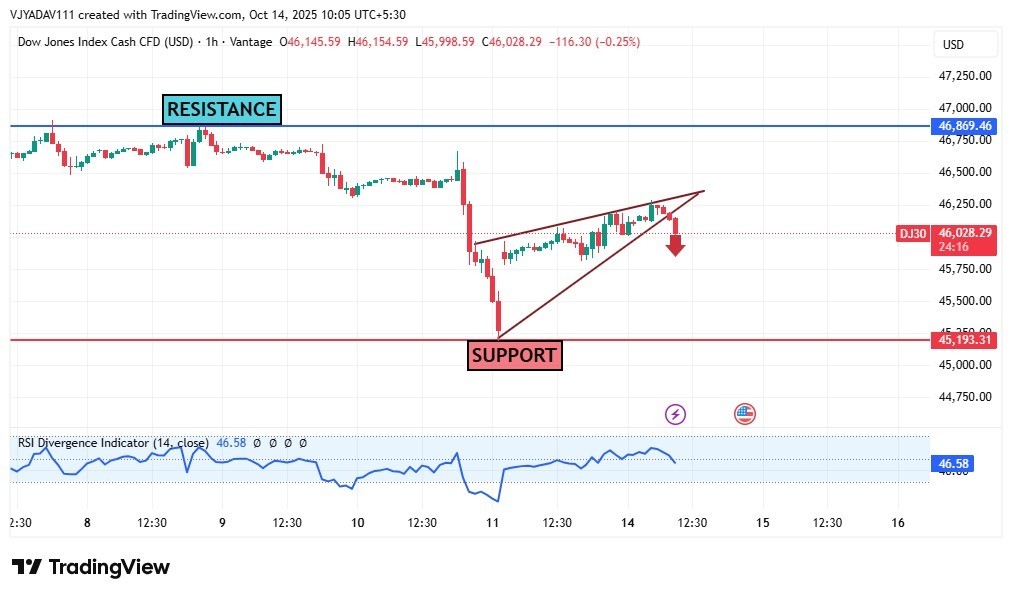
DOW JONES making a rising wedge in 1hr t...
October 14, 2025
Market Insights
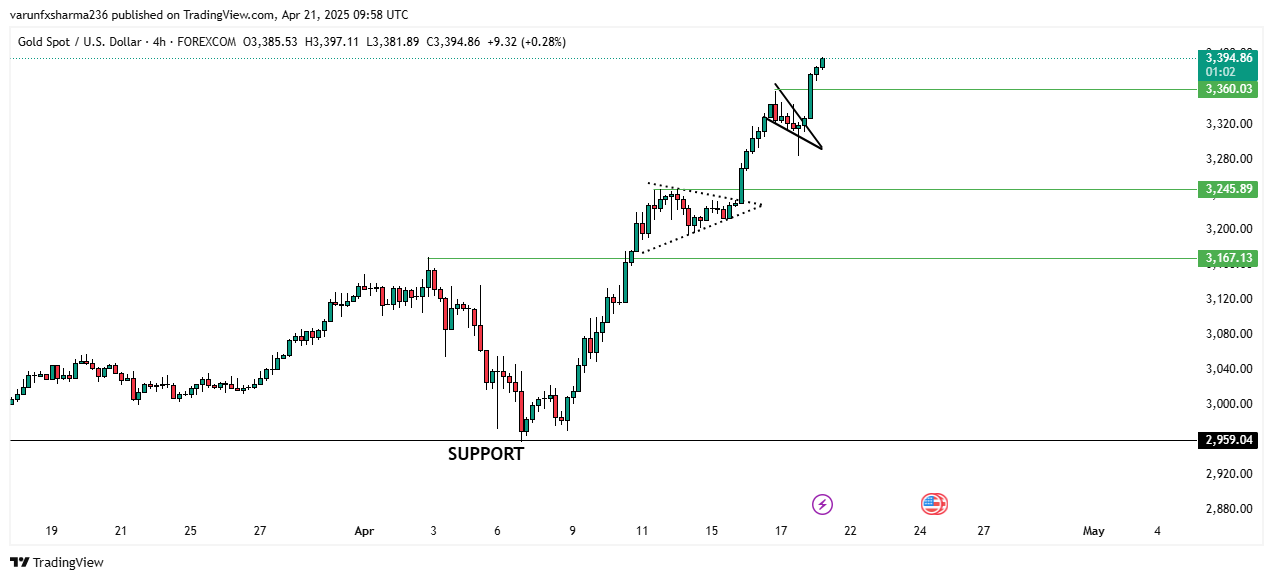
Gold Breaks Record Highs at $3,397 Amid...
April 21, 2025
Market Insights
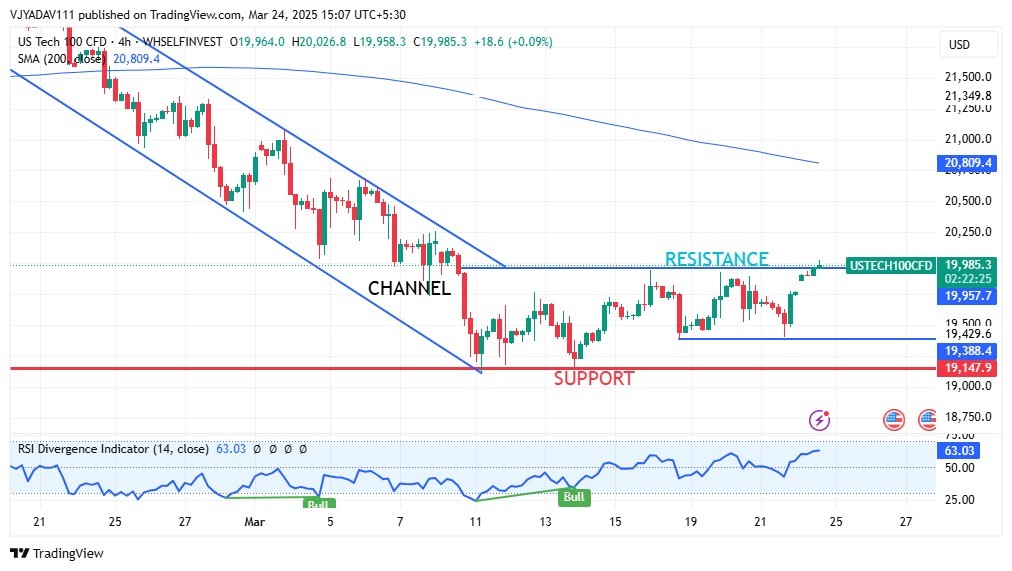
US Tech 100 Breaks Out of Downward Chann...
March 24, 2025
Market Insights
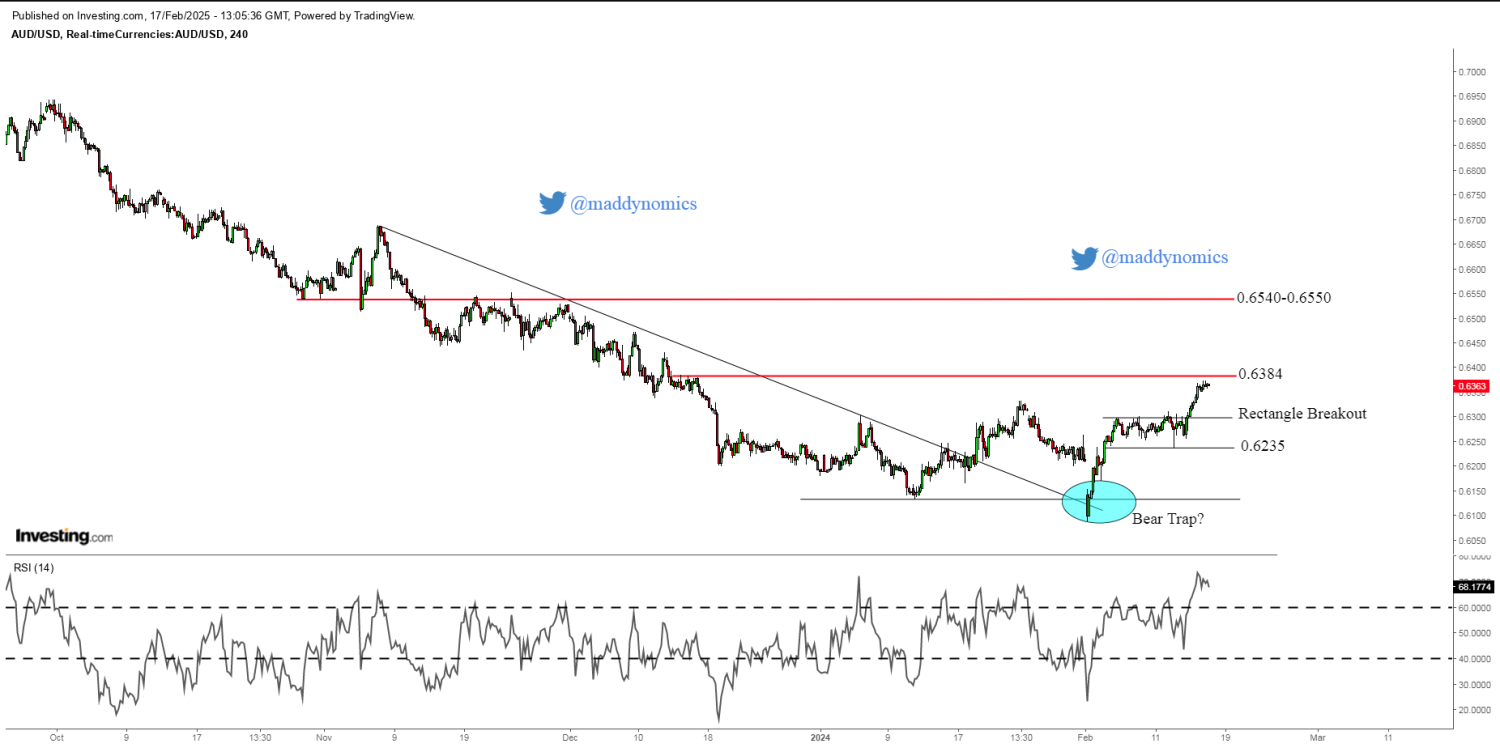
Can AUDUSD start a Multi-Month Bull run?
February 17, 2025
Market Insights
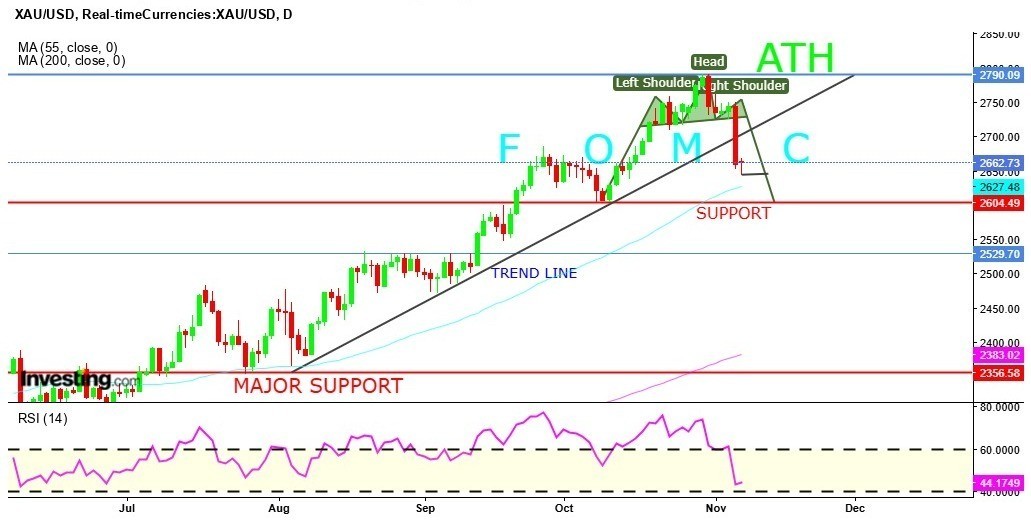
Federal Open Market Committee (FOMC):-
November 07, 2024
Market Schedule


