Gold faces pressure amid renewed US-EU trade talks and a strengthening U.S. dollar.
Gold extended its decline on Tuesday, breaking below the $3,300 mark as a confluence of factors weighed on the metal. A stronger U.S. dollar and a rebound in risk appetite prompted investors to rotate out of safe-haven assets, while profit booking following recent highs added to the selling pressure. The market also responded to easing geopolitical tensions after President Trump announced a delay of the proposed 50% tariff on the European Union until July 9, reducing the immediate appeal of gold as a hedge. Looking ahead, investors remain focused on key economic data releases and signals from major central banks for further direction.
XAU/USD TECHNICAL OVERVIEW
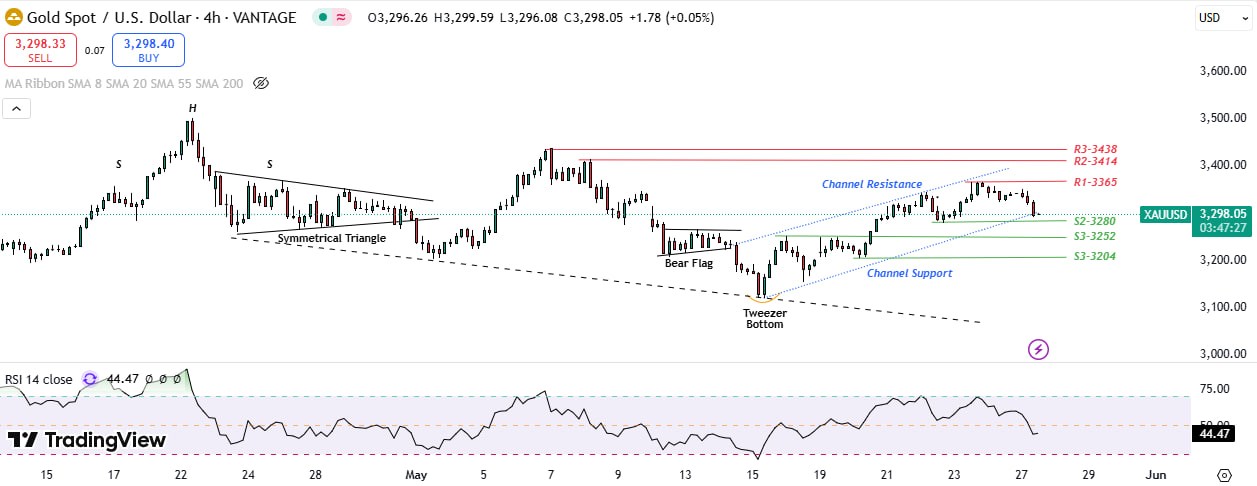
Technical Structure: Gold is currently displaying signs of weakness on multiple timeframes. On the daily chart, a Hanging Man candlestick pattern has emerged, suggesting potential exhaustion of the recent bullish move. Price remains above the 20-day SMA, but momentum appears to be softening. On the 4-hour chart, Gold is hovering near channel support, indicating a critical juncture—either a rebound or a breakdown. The 1-hour timeframe is showing a bearish flag formation, typically a continuation pattern signaling further downside if support breaks.
Intraday Trend/ Intraday Strategy: The intraday bias remains bearish and favours the strategy of selling on support breakdown and selling on rise.
Weekly Trend: Bullish
Major Support: 3280, 3270, 3252
Major Resistance: 3307, 3329, 3348
Recent News
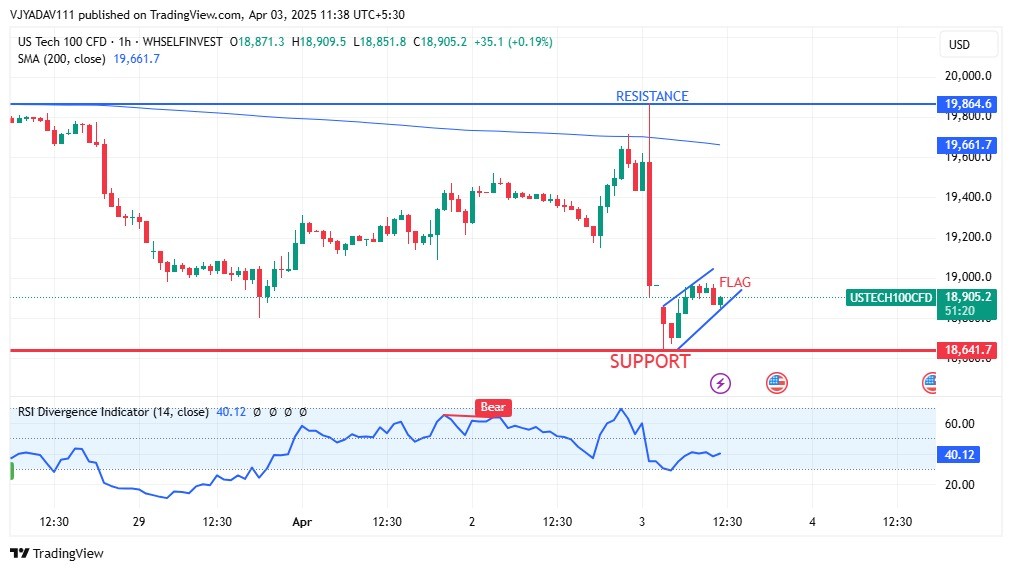
US Tech 100 Struggles Below Key Resistan...
April 03, 2025
Market Insights
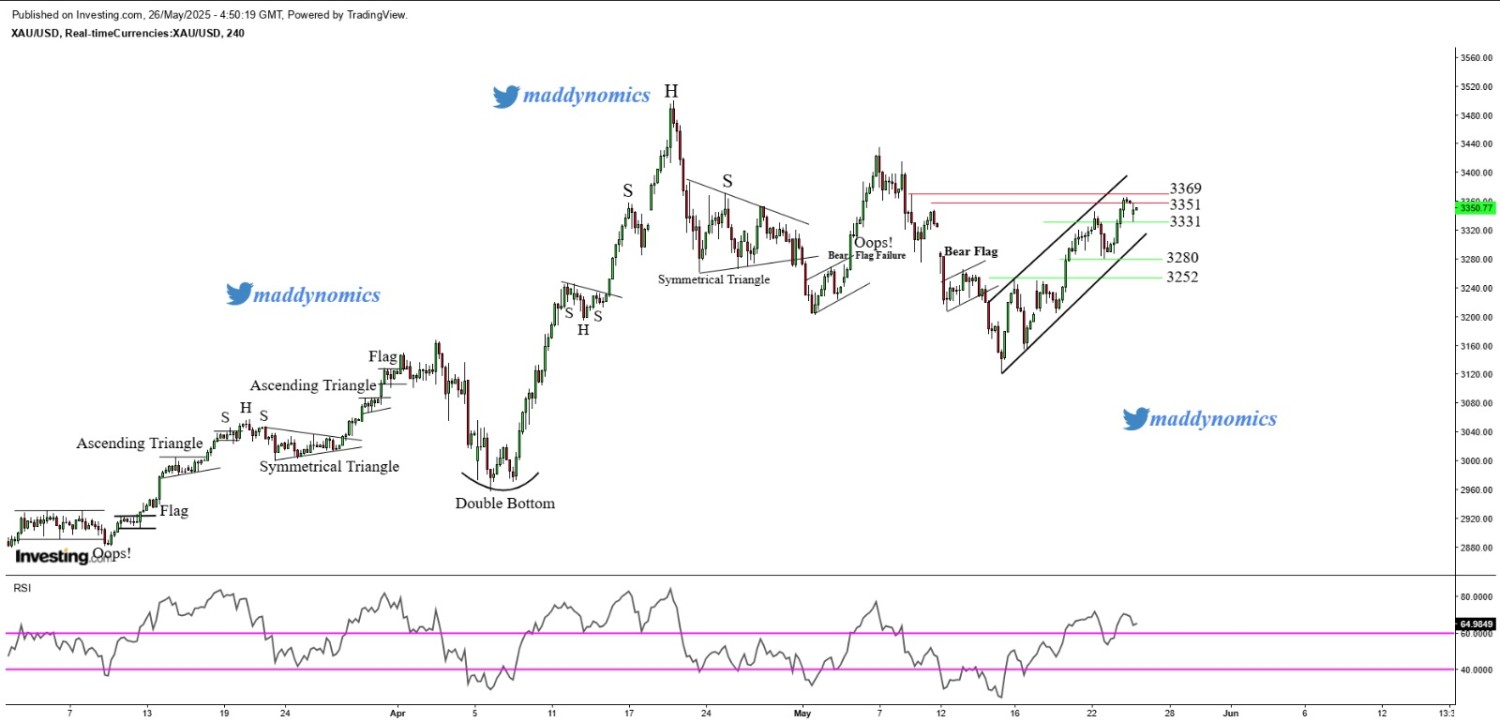
Gold registers mild losses on Monday but...
May 26, 2025
Market Insights
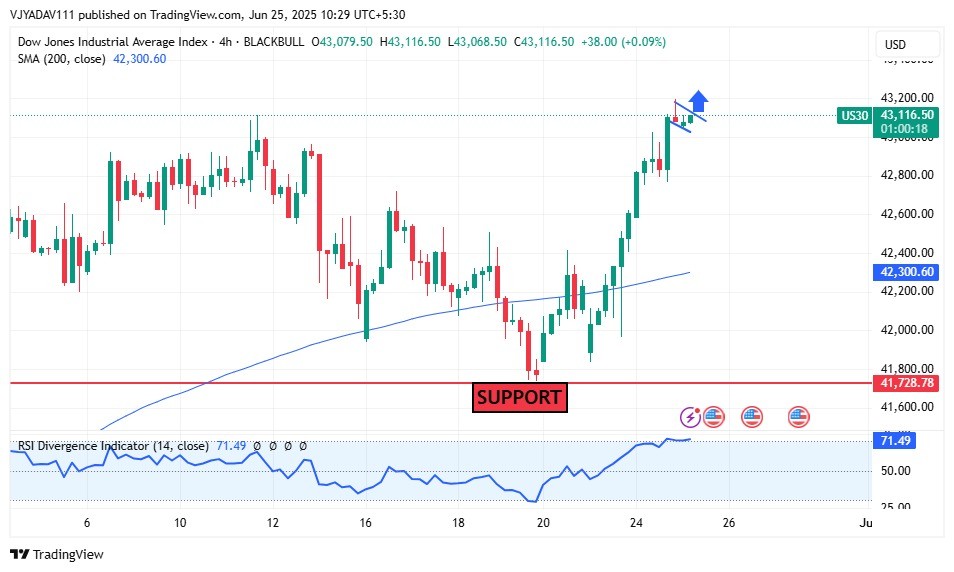
Dow Jones Momentum Surges Bulls Push Bey...
June 25, 2025
Market Insights
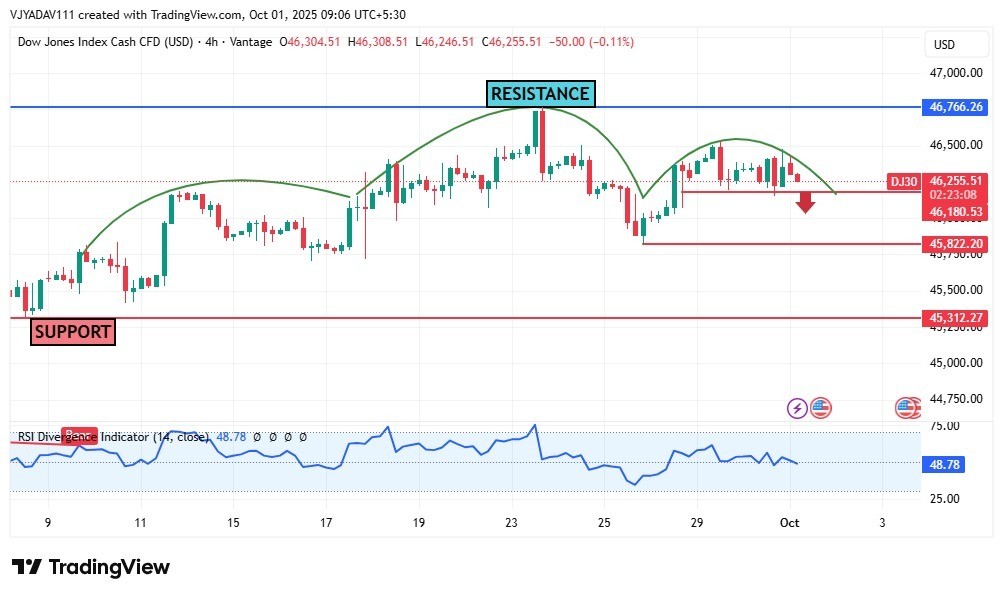
Dow Jones Forms Double-Top Pattern, Risk...
October 01, 2025
Market Insights
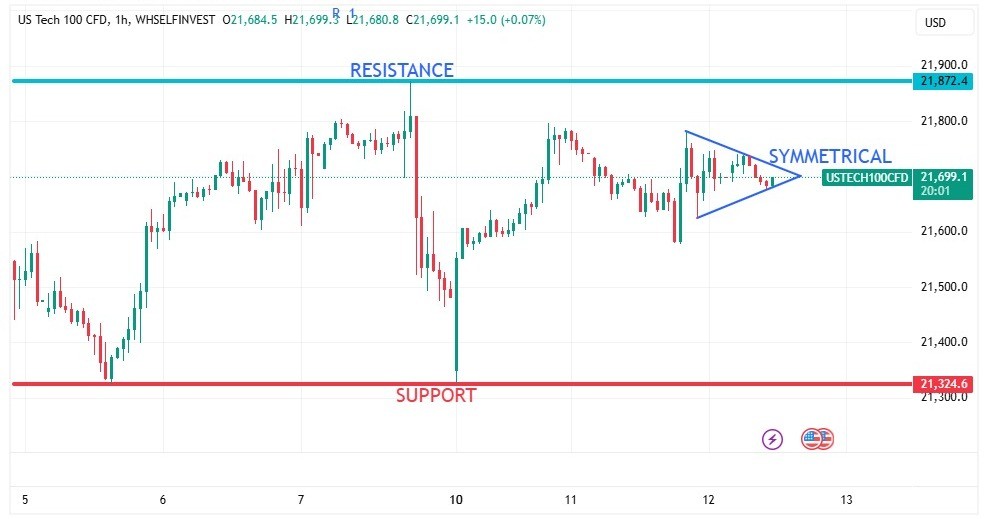
NASDAQ making a Symmetrical in 1HR
February 12, 2025
Market Insights
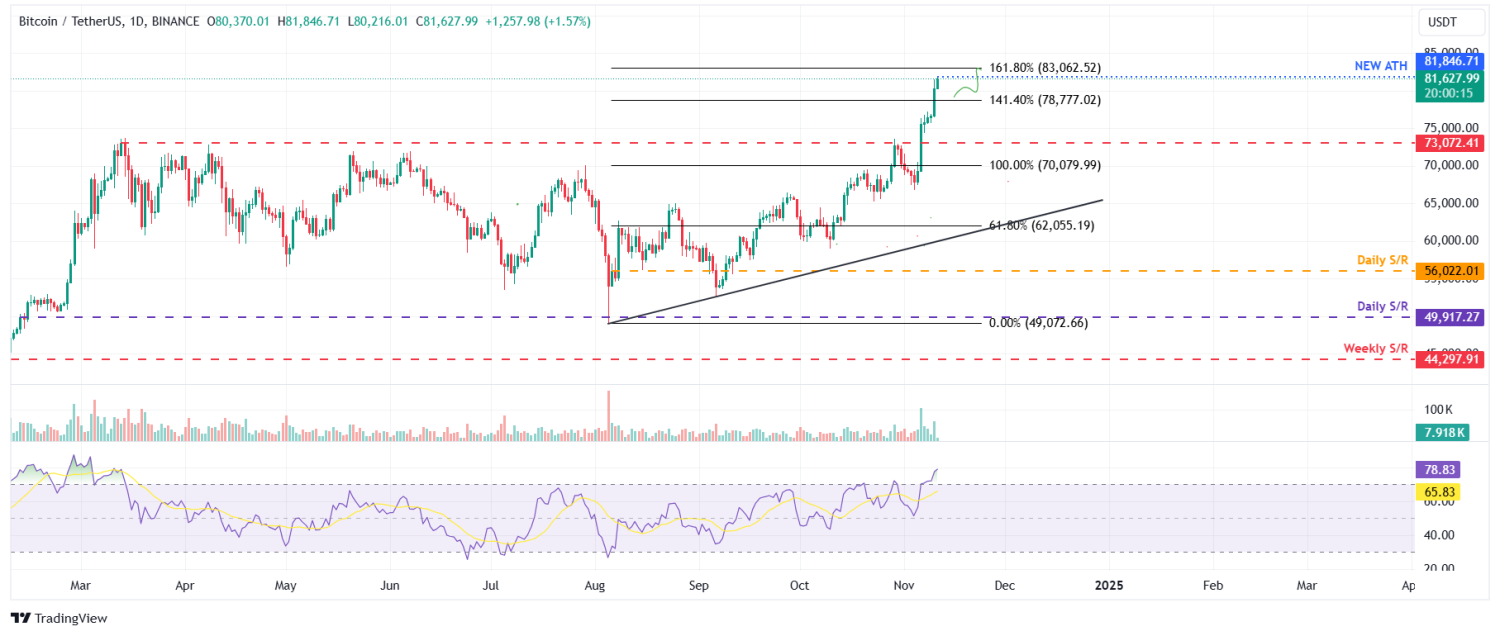
Bitcoin Bulls Target $83,000 Milestone A...
November 11, 2024
Market Insights


