Gold Daily Chart Analysis: Strong Rebound from Ascending Channel Midline Signals Potential Rally Toward $3,000
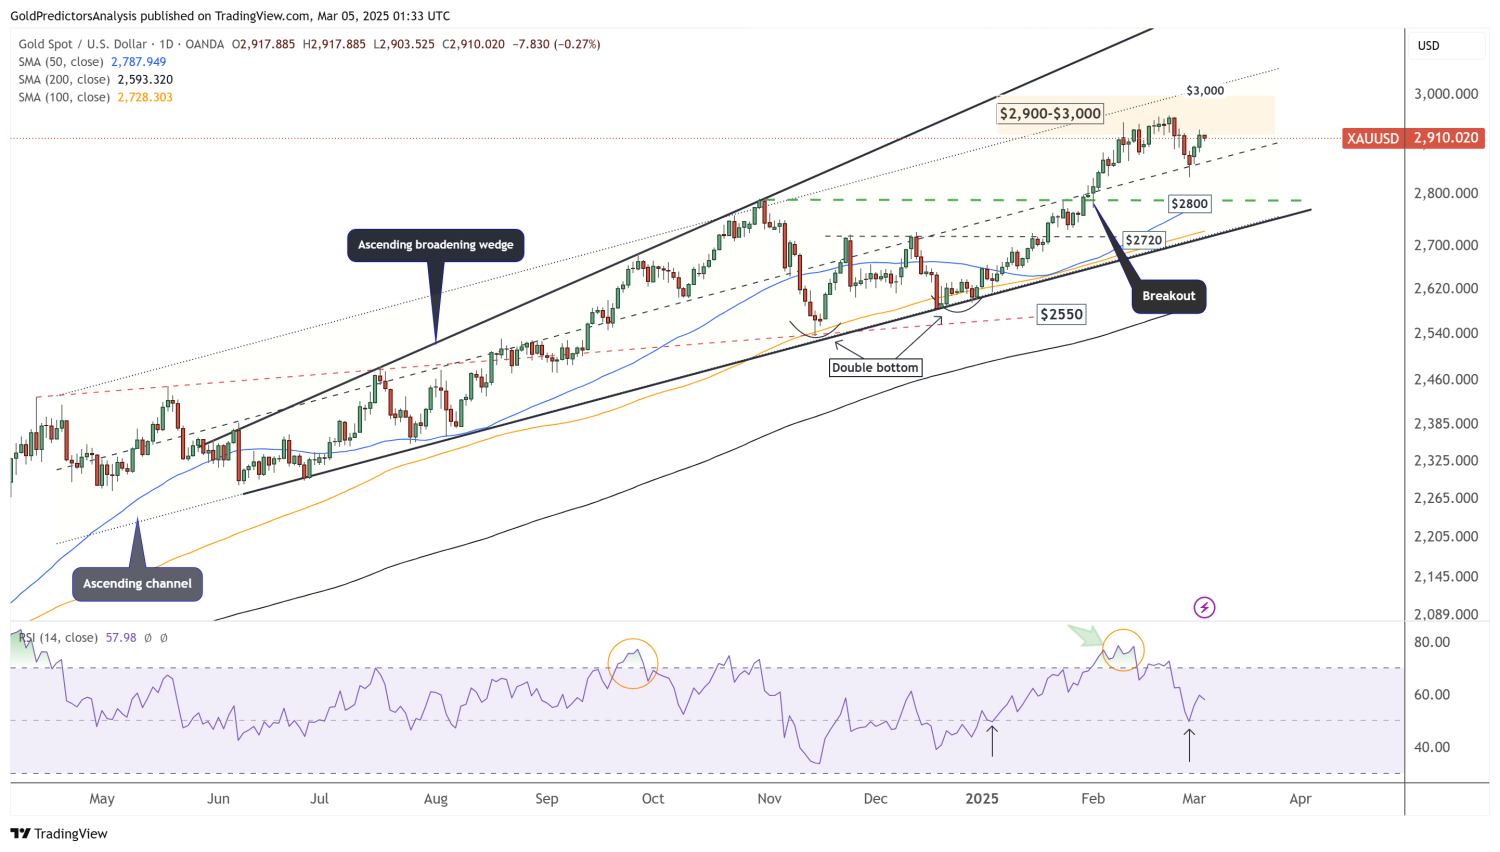
The daily chart for gold indicates a significant rebound after finding strong support at the midline of the ascending channel. This move has triggered a recovery in the Relative Strength Index (RSI) from the mid-level, reinforcing the support zone's strength.
The recent bullish price action suggests that gold is preparing for a potential rally towards the $3,000 mark. If the price sustains above this midline support, momentum could accelerate, targeting new highs.
Recent News

Gold Glitters But Faces a Moment of Caut...
April 15, 2025
Market Insights
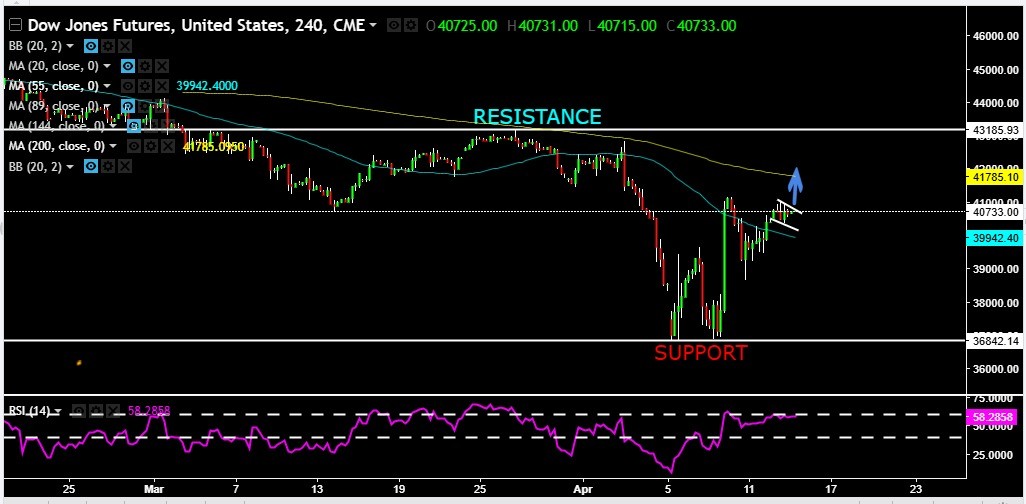
Dow Jones Futures Poised for a Major Bre...
April 15, 2025
Market Insights
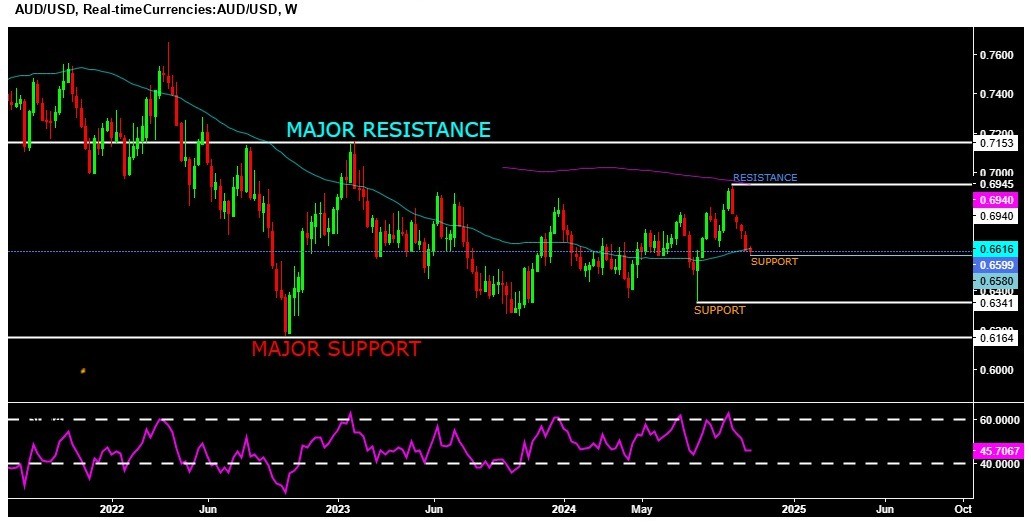
AUDUSD trading at oversold range as per...
October 28, 2024
Market Insights
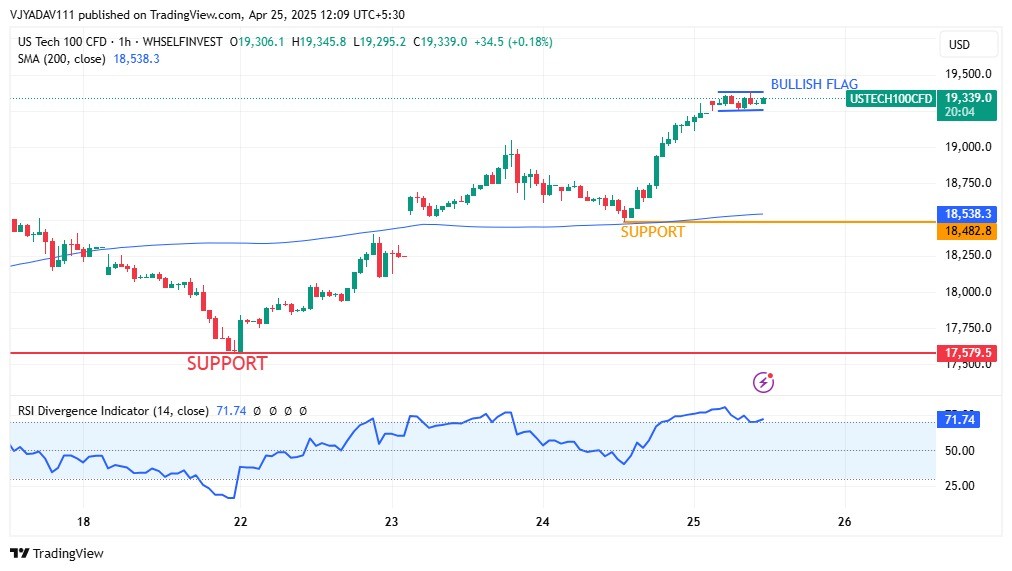
US Tech 100 Surges with Bullish Flag Nea...
April 25, 2025
Market Insights
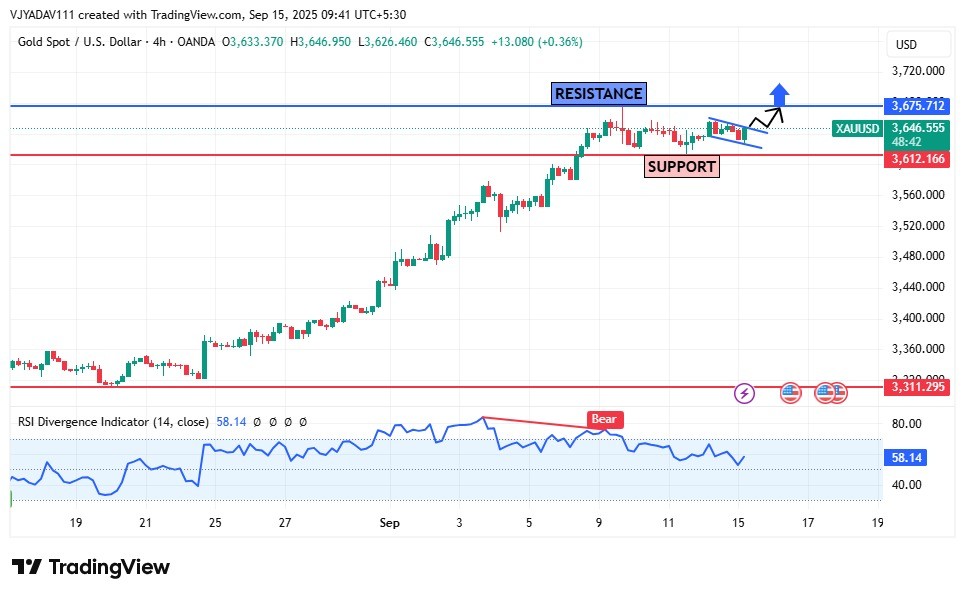
Gold (XAUUSD) Consolidating Above $3,612...
September 15, 2025
Market Insights
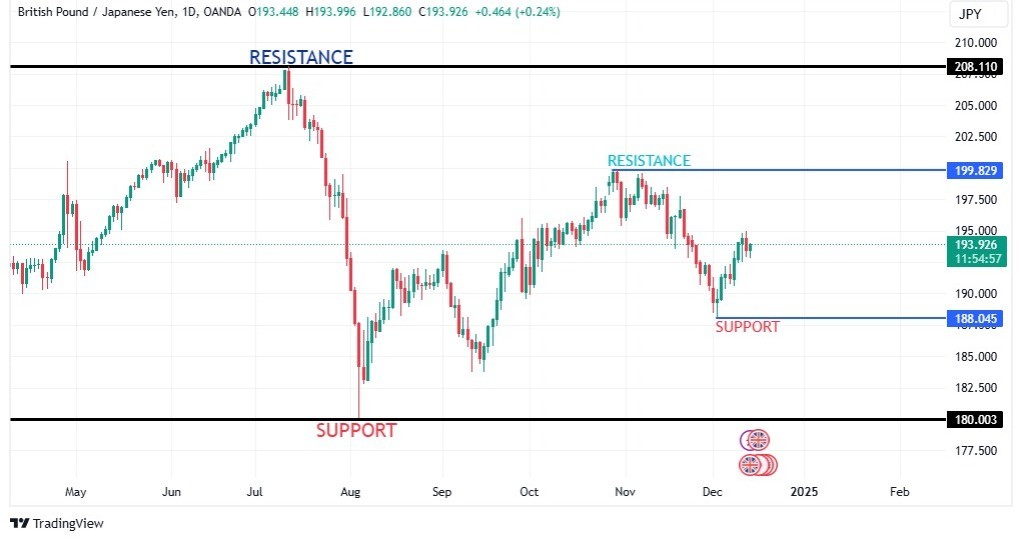
GBPJPY facing a daily resistance
December 13, 2024
Market Insights


