Gold at a crossroad: RSI Divergence is signaling some caution ahead
Gold eased back from the $3,400 zone after hitting a two-week high, retreating toward $3,375. The pullback comes as traders await key US economic data, including Q2 GDP revision, Jobless Claims, and Pending Home Sales, to gauge the Fed’s next move. Odds of a September rate cut remain near 90% after dovish remarks from Fed’s John Williams, keeping downside limited.
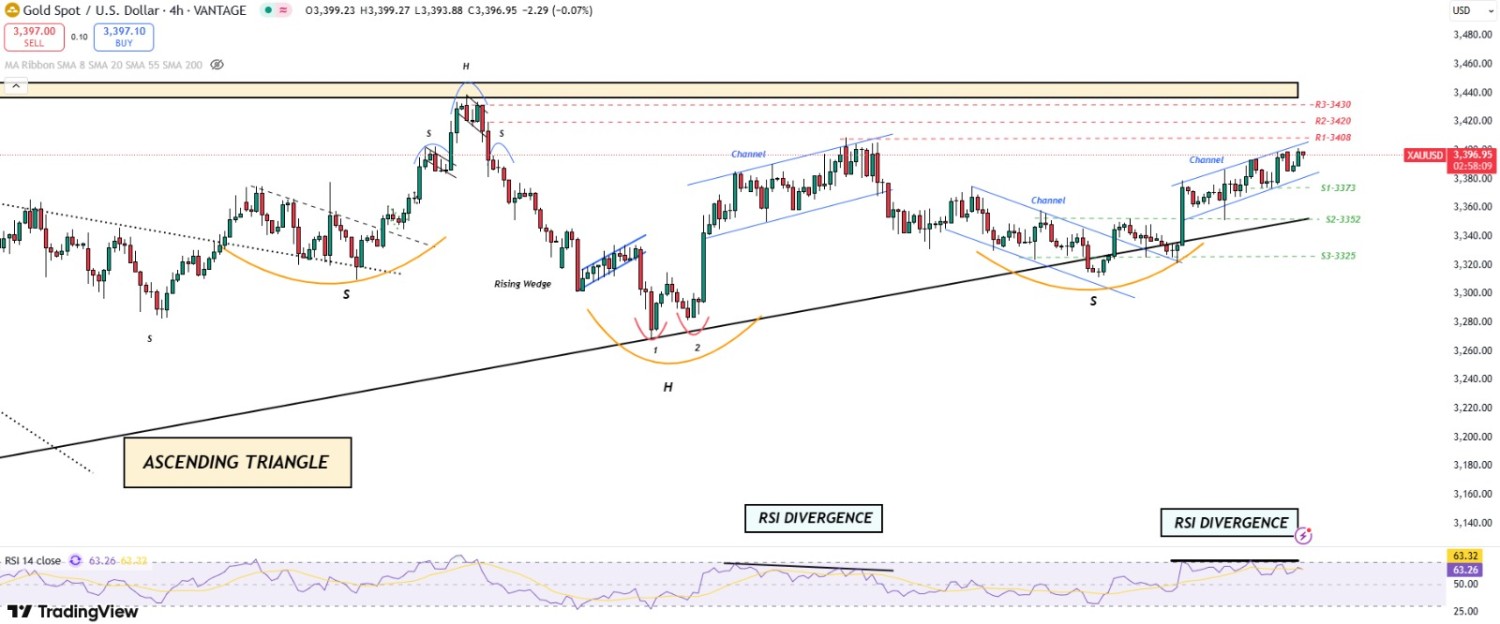
Concerns over the Fed’s autonomy, Trump’s tussle with Fed Governor Lisa Cook, and renewed global trade tensions are adding a safe-haven bid. Technically, buyers are struggling to clear the $3,400 barrier, with RSI divergence flashing caution, suggesting momentum may stay capped in the near term.
XAU/USD TECHNICAL OVERVIEW
Technical Structure: On the daily chart, a Hanging Man candle signals caution, although price action remains above the 20-SMA, keeping the broader structure intact. On the 4H chart, RSI divergence highlights fading bullish momentum, while the 1H timeframe shows consolidation, suggesting indecision.
Weekly Trend: Bullish
Intraday Trend/ Intraday Strategy: Bearish bias – preference for selling on support breakdowns or selling into rises.
Major Support: 3384, 3373, 3360
Major Resistance: 3400, 3410, 3420
Recent News
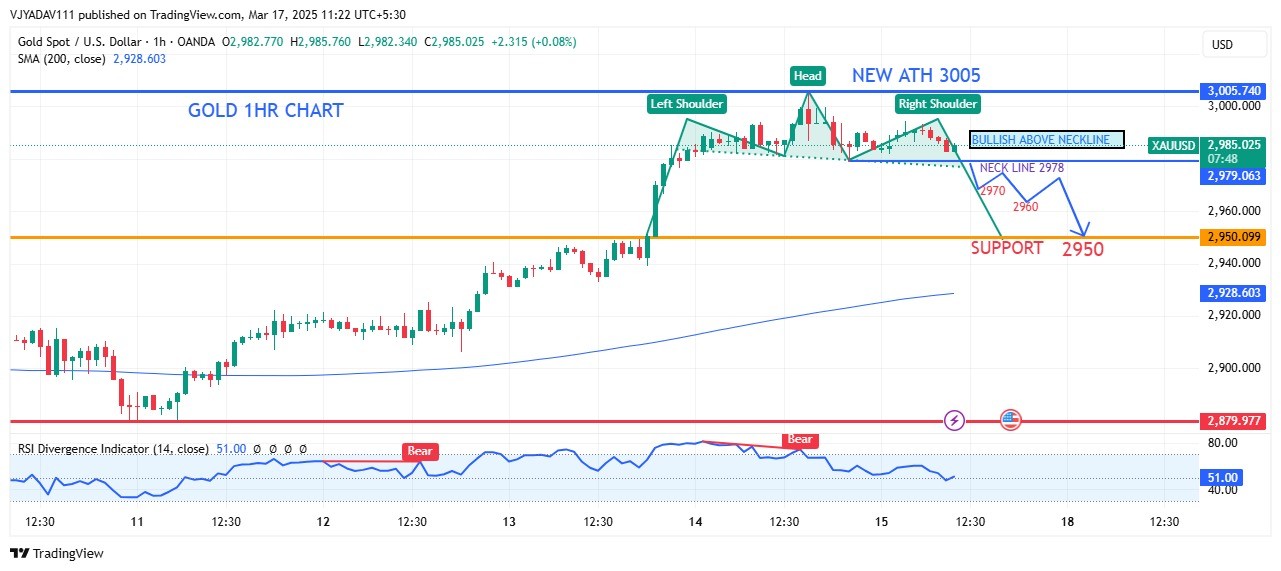
Gold 1 Hour Chart Analysis Bullish Break...
March 17, 2025
Market Insights
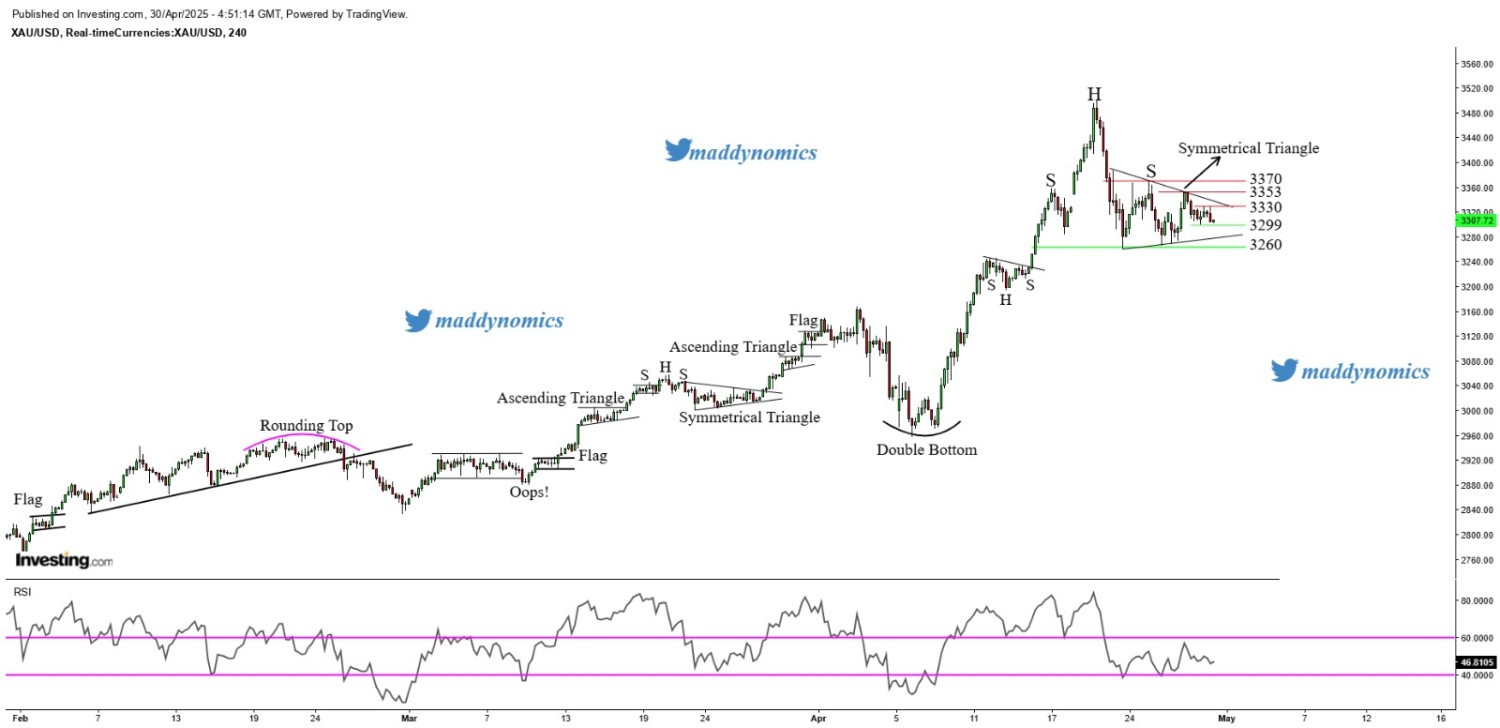
Gold consolidates to build up momentum a...
April 30, 2025
Market Insights
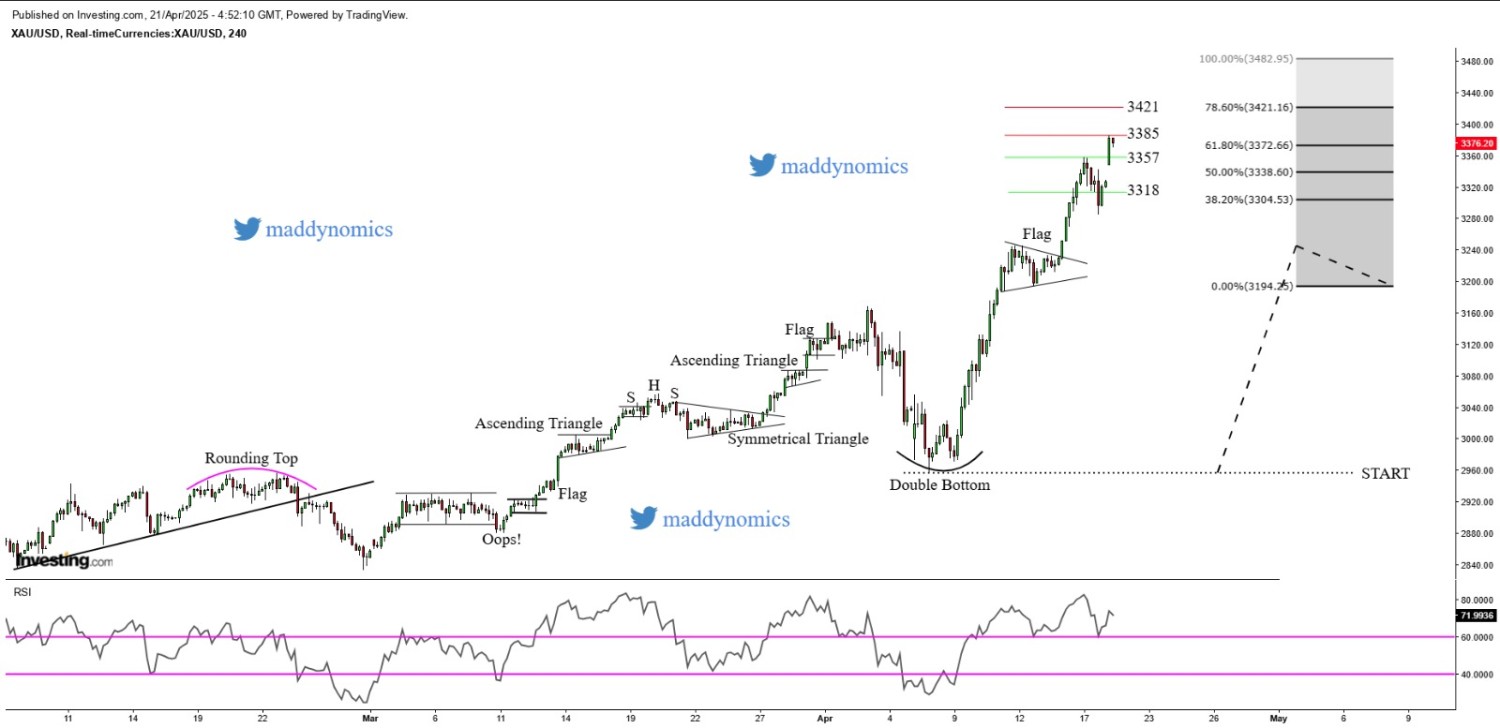
Gold soars to unprecedented highs driven...
April 21, 2025
Market Insights
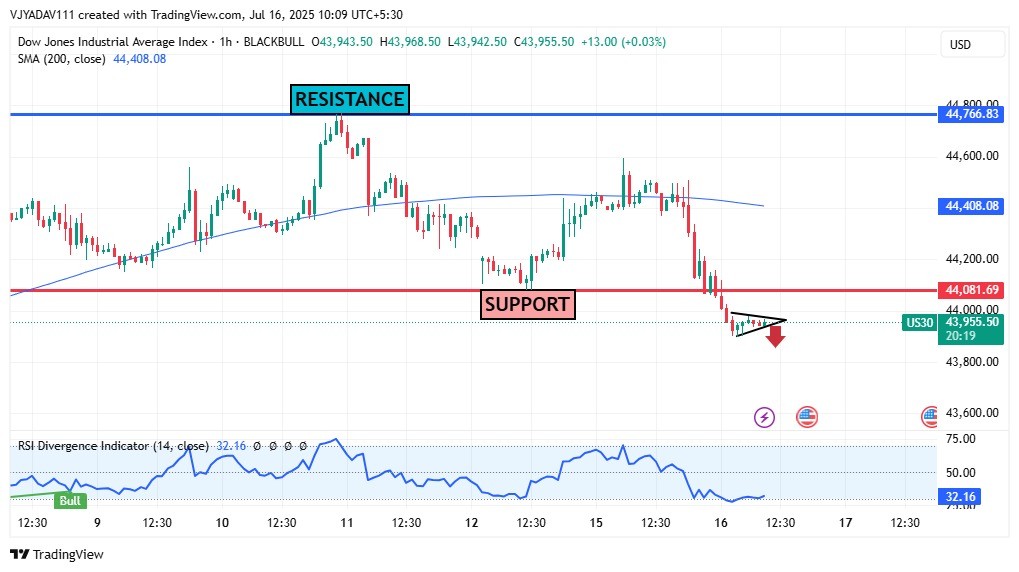
US30 Forms Bearish Pennant Below Key Sup...
July 16, 2025
Market Insights
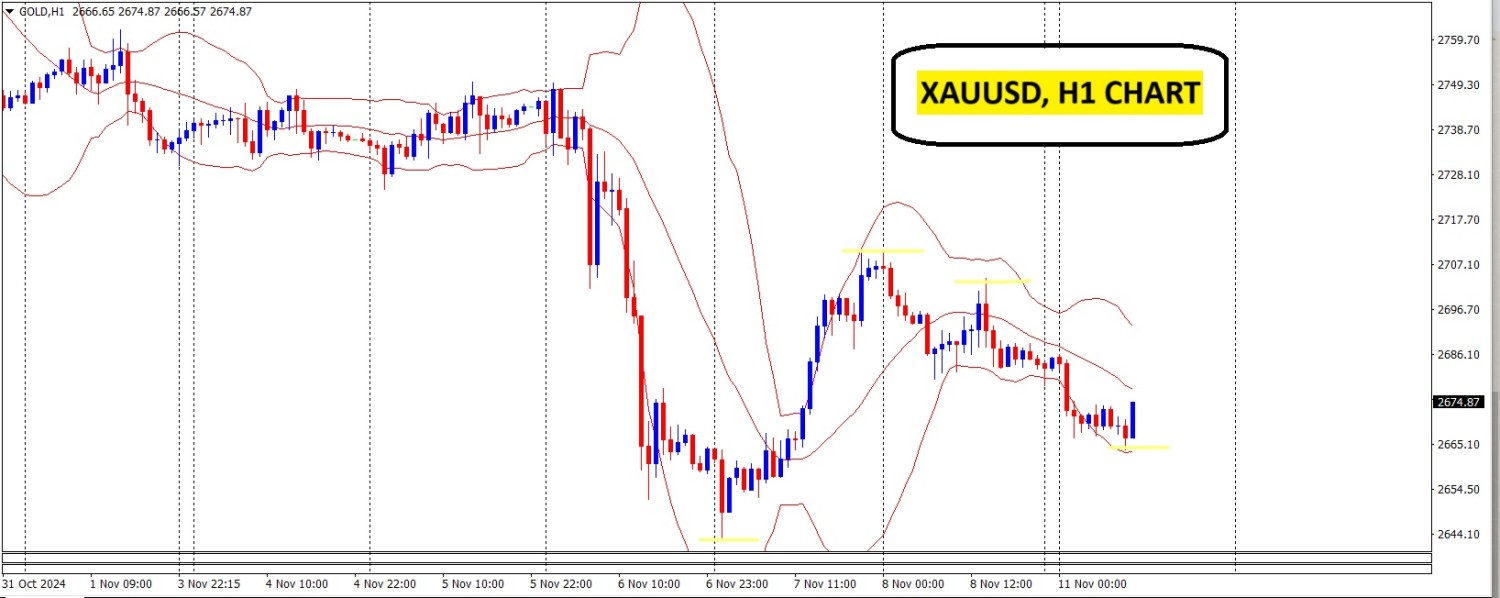
Gold price languishes near daily low ami...
November 11, 2024
Market Insights
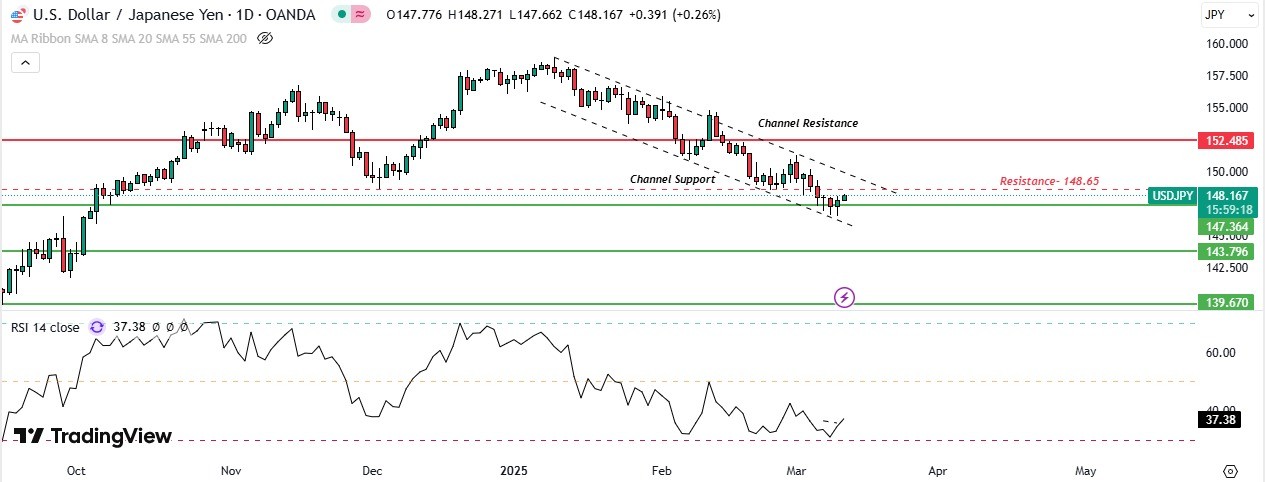
USD/JPY shows signs of recovery, stickin...
March 12, 2025
Market Insights


