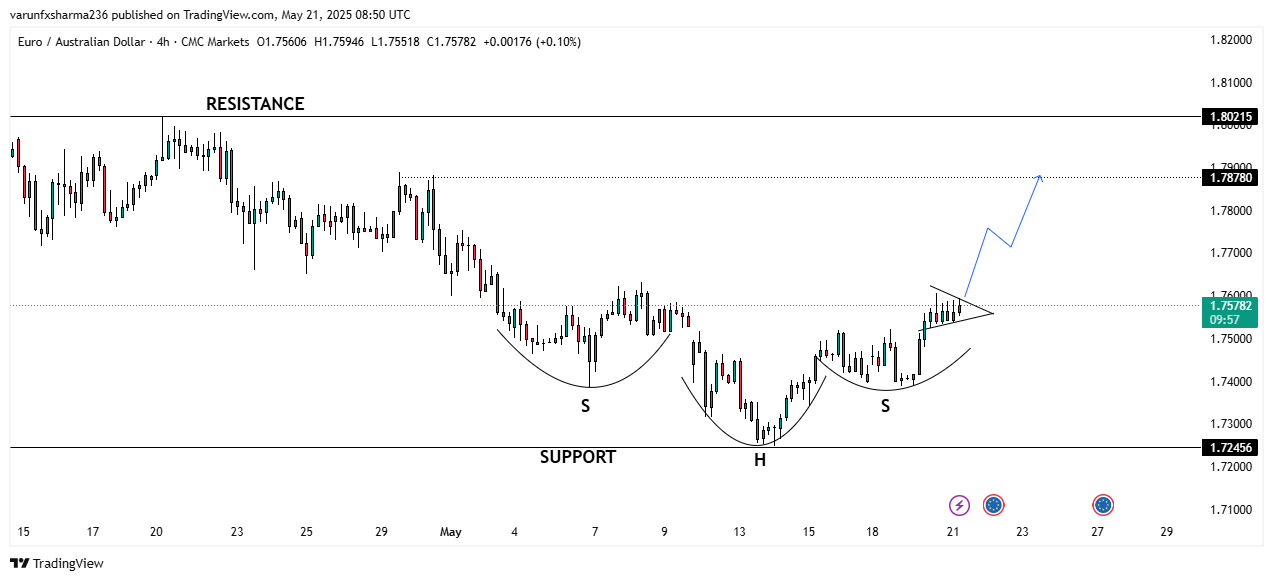
EUR/AUD – Bullish Reversal Pattern Indicates Potential Upside Move
Key Observations:
-
Pattern Structure:
-
The left shoulder (S) formed around May 4–6.
-
The head (H) is clearly visible at the low around May 12–13.
-
The right shoulder (S) was completed around May 17–19.
-
-
Neckline Breakout:
The price is now testing a neckline resistance zone, and a potential breakout to the upside is forming as the pair consolidates in a bullish symmetrical triangle. -
Support & Resistance:
-
Support: 1.72456
-
Immediate Resistance: 1.78780
-
Major Resistance: 1.80215
-
-
Price Target:
If the breakout holds, the price could rally toward the 1.78780 level, which aligns with the projected height of the inverse head and shoulders pattern added to the breakout point. A further extension toward 1.80215 is possible if momentum sustains.
Recent News
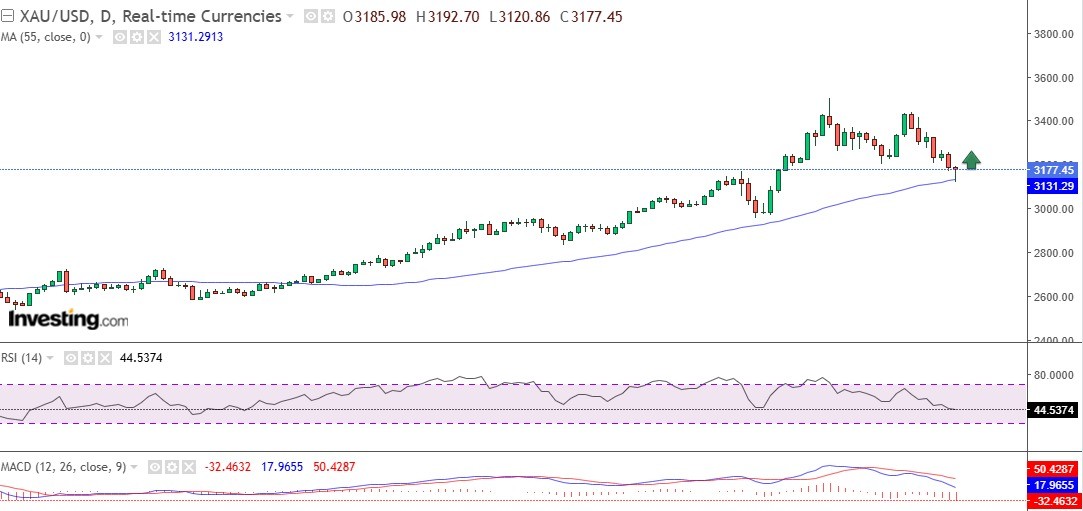
Gold swiftly bounces back from 55-SMA on...
May 15, 2025
Market Insights
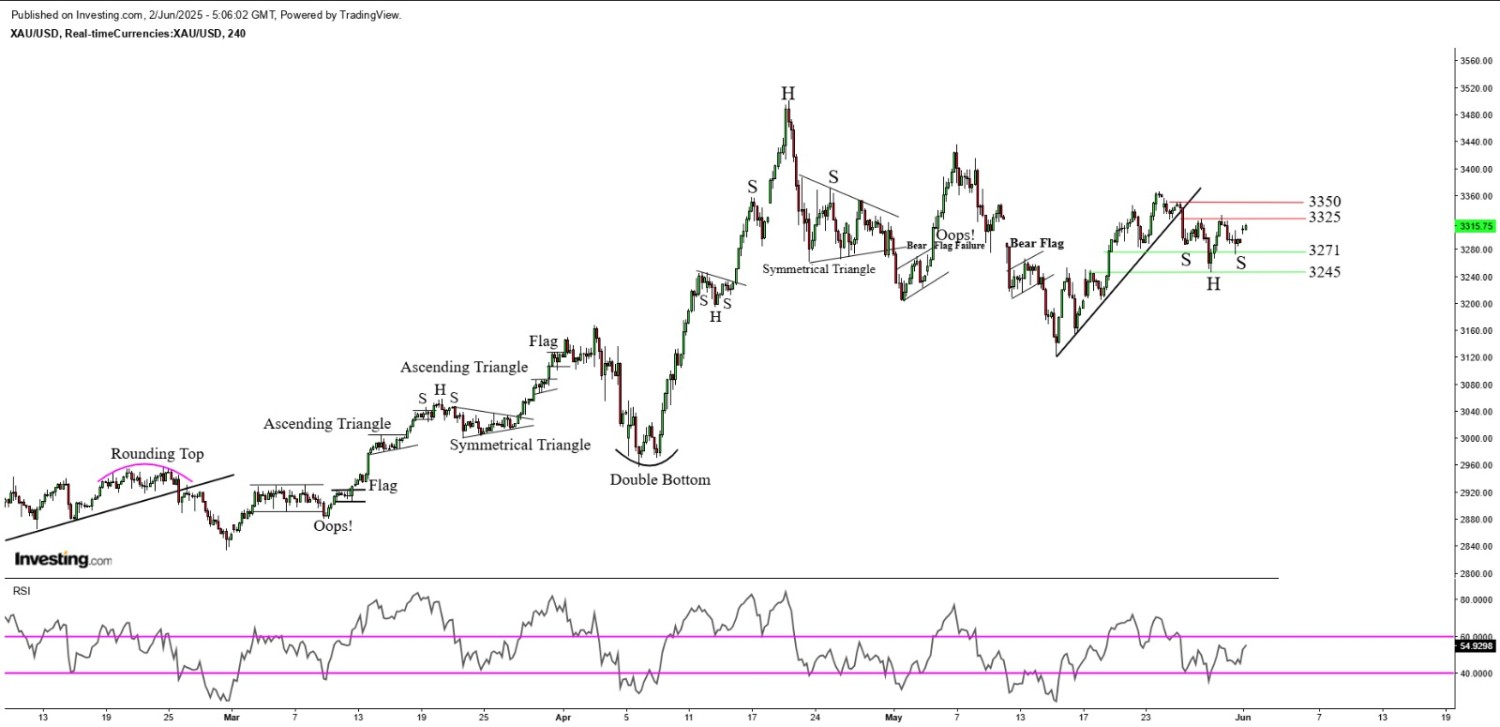
Inverted Head & Shoulders pattern emerge...
June 02, 2025
Market Insights
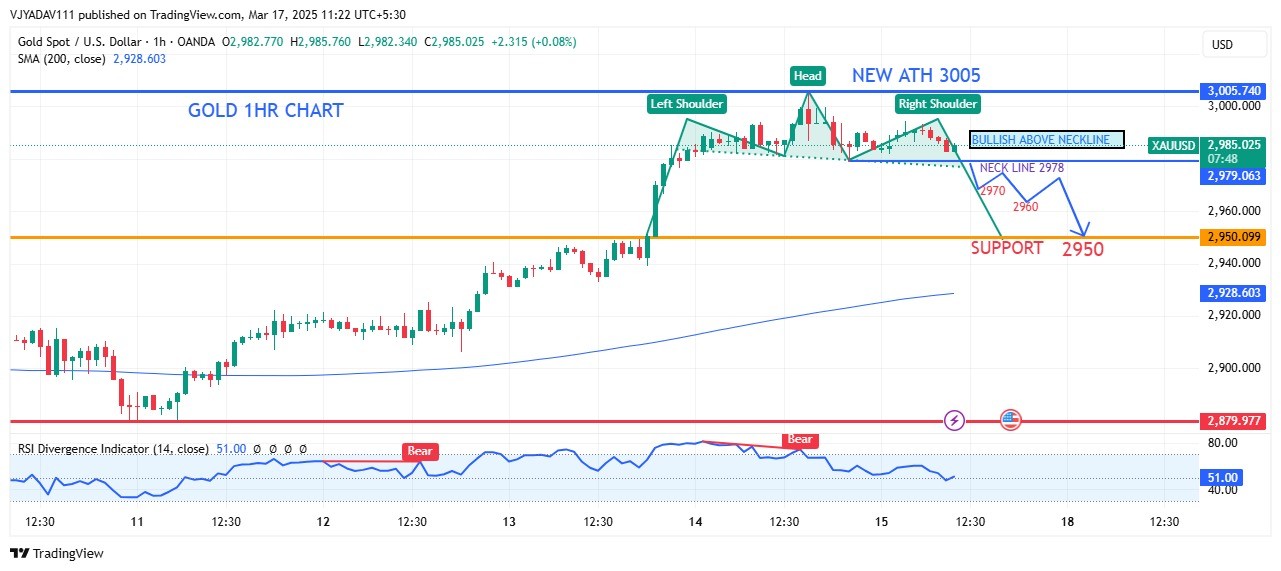
Gold 1 Hour Chart Analysis Bullish Break...
March 17, 2025
Market Insights
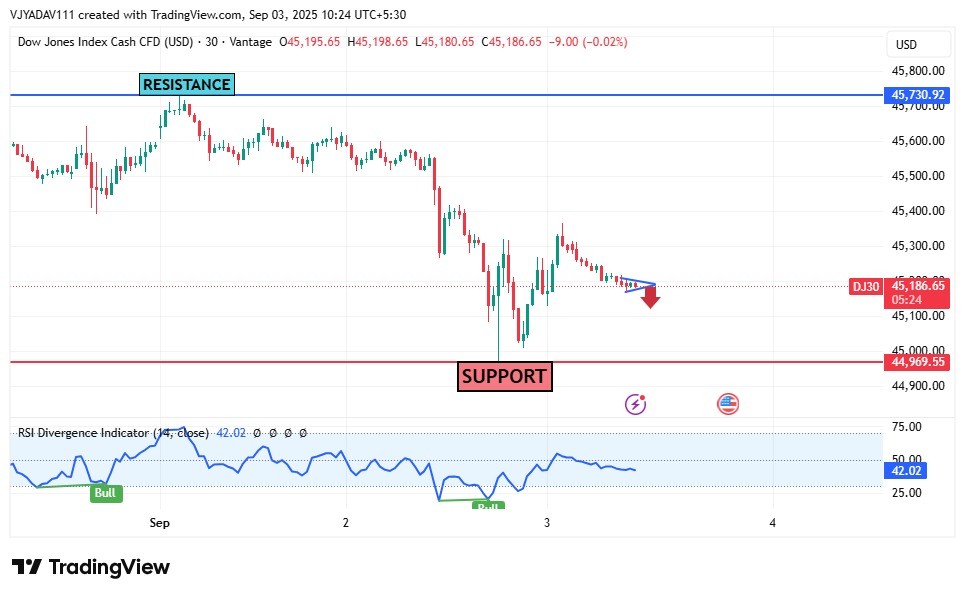
Dow Jones Faces Bearish Pressure: Resist...
September 03, 2025
Market Insights
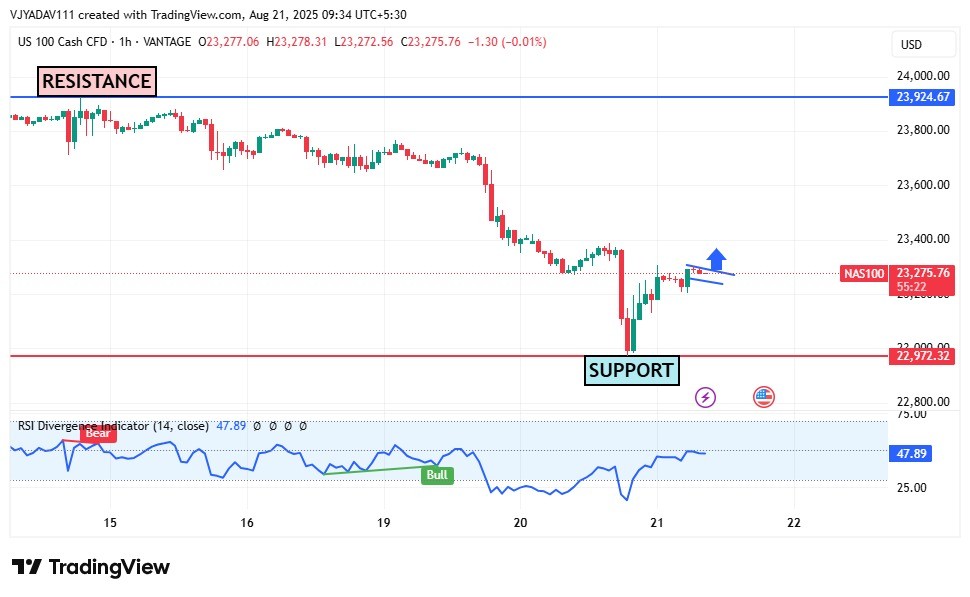
NASDAQ 100 Forms Bullish Flag Near Suppo...
August 21, 2025
Market Insights
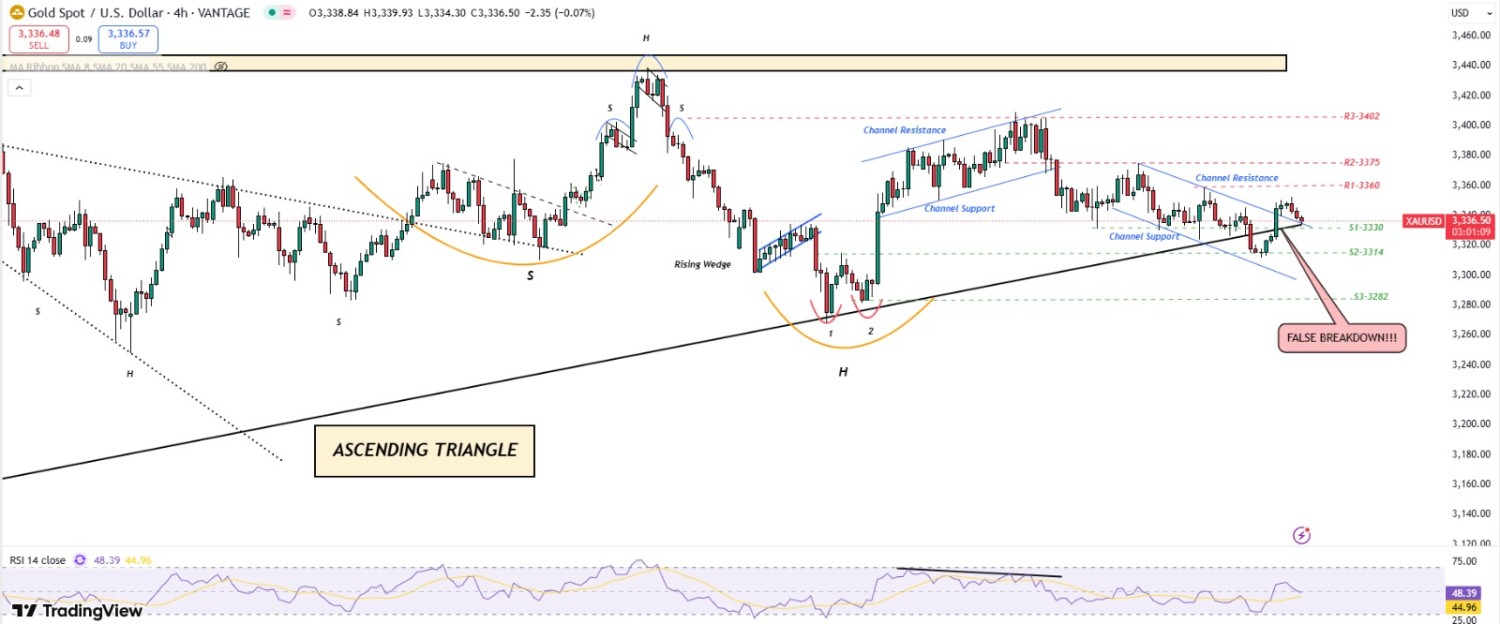
Gold holds at Ascending Triangle Support...
August 21, 2025
Market Insights


