US Tech 100 Chart Inverse Head and Shoulders Pattern Suggests Bullish Breakout Toward Resistance at 21,094
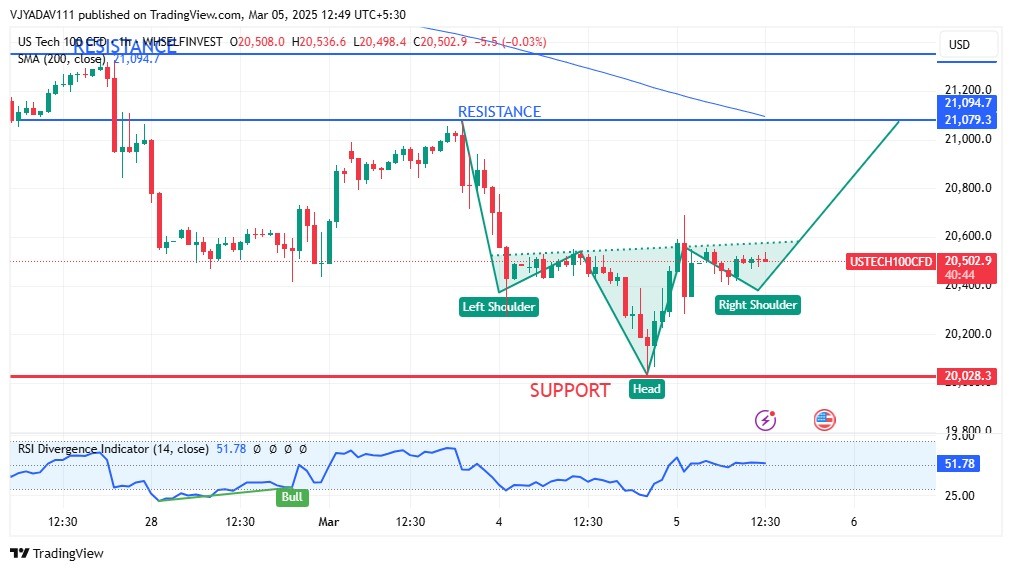
NASDAQ was up on Wednesday morning after testing the low level of 20075 in the last trading session as US stock futures climbed on Wednesday after Commerce Secretary Howard Lutnick indicated that a potential compromise on tariffs between the US, Canada, and Mexico could be in the works.
Recent News
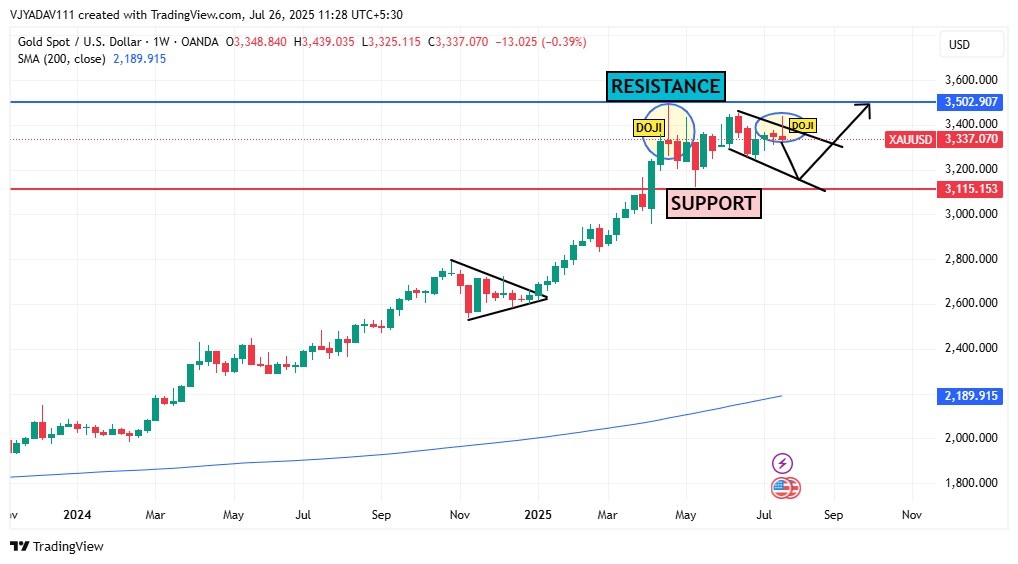
GOLD Weekly Chart Highlights Consecutive...
July 26, 2025
Market Insights
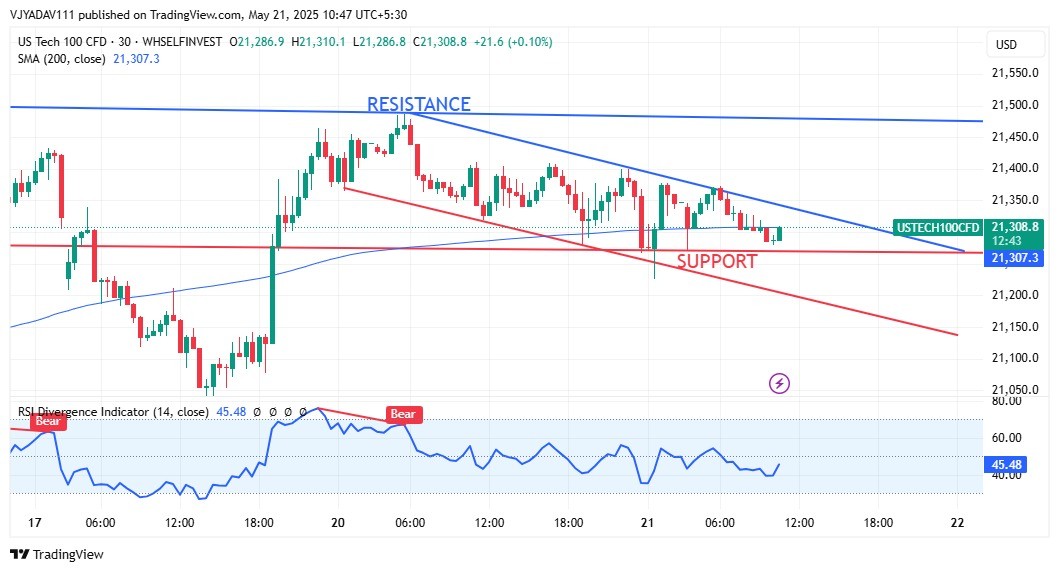
US Tech 100 at Crossroads Descending Cha...
May 21, 2025
Market Insights
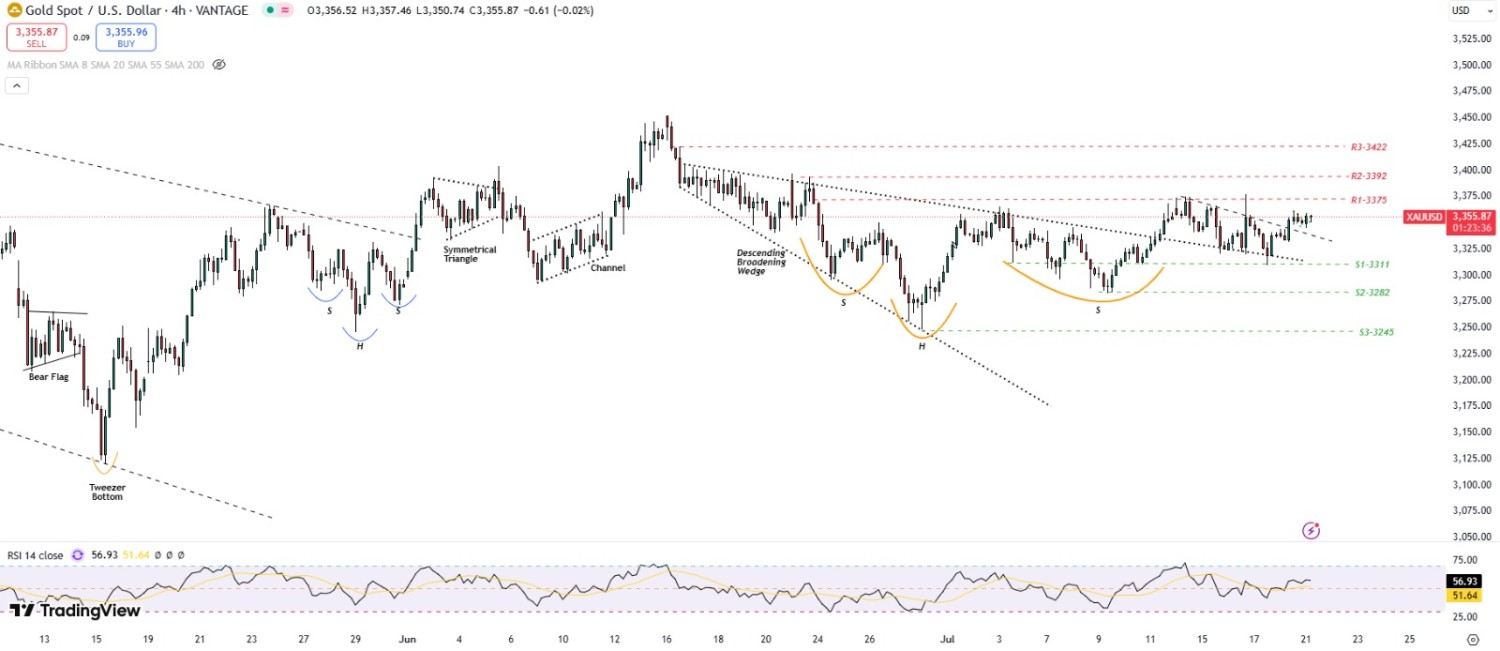
Gold edges higher amid tariff tensions a...
July 21, 2025
Market Insights
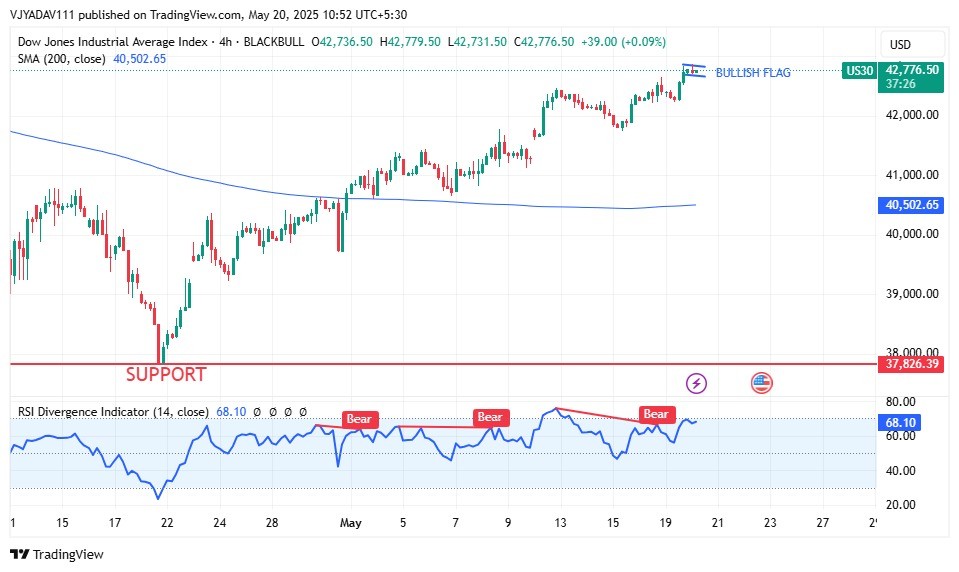
Dow Jones Breaks Out of Bullish Flag For...
May 20, 2025
Market Insights
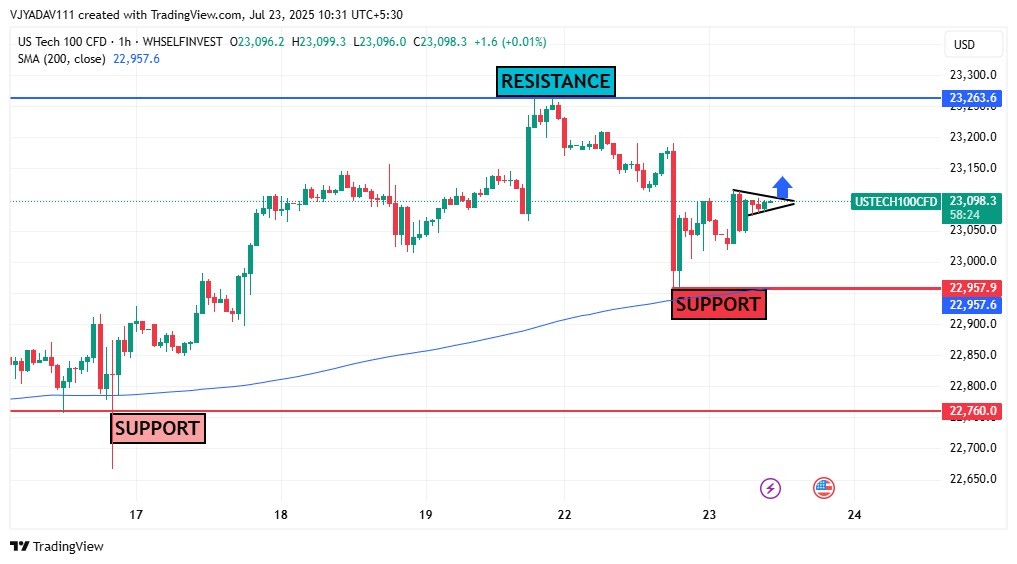
US Tech 100 Forms Bullish Pennant Eyes o...
July 23, 2025
Market Insights

Gold price moves away from one-week top...
November 20, 2024
Market Insights