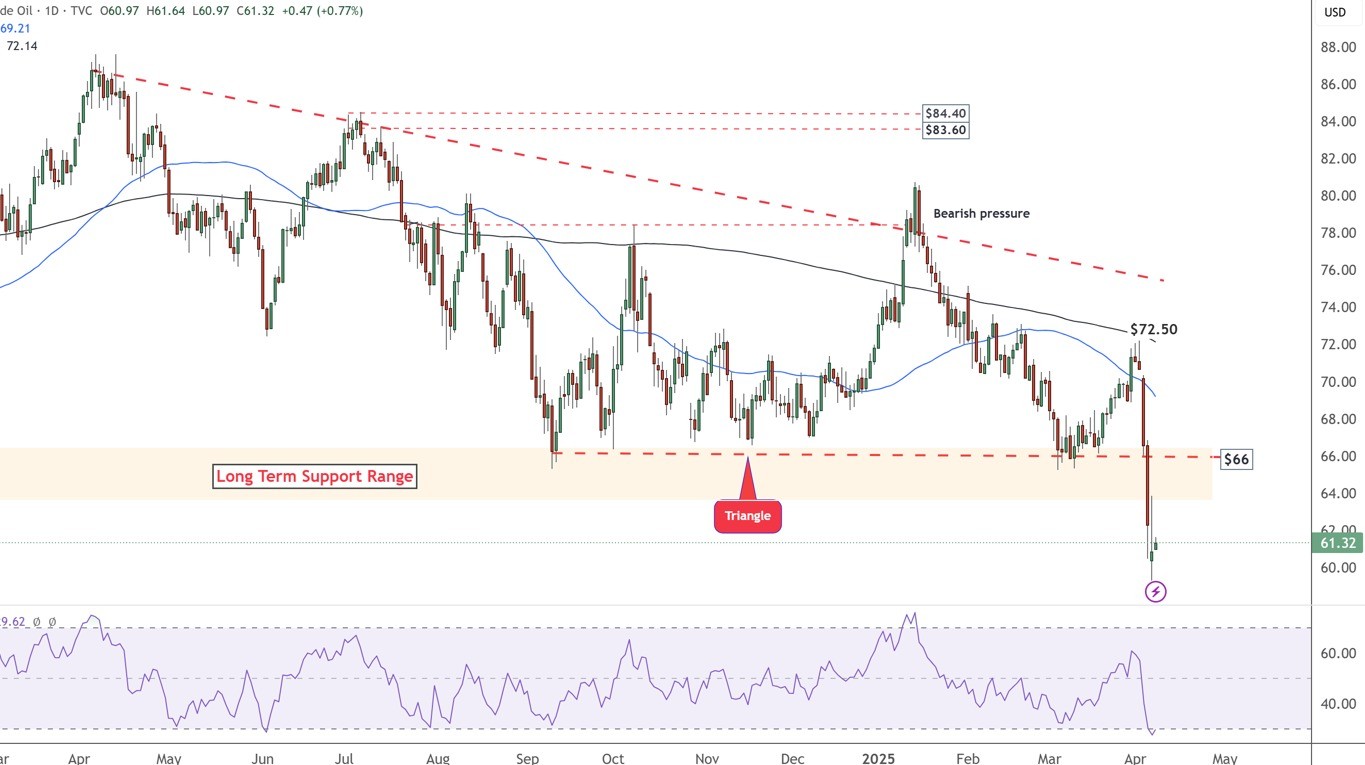
WTI Crude Oil Breaks Key Support, Extends Bearish Momentum Amid Global Demand Fears
Key Technical Highlights:
-
Support Break:
Price has broken below the long-term $65–$66 support zone, triggering a sharp selloff. This support had held for years, so breaking it is a significant bearish signal. -
Chart Pattern:
A triangle pattern was violated (red-dotted trendline), confirming bearish continuation and amplifying downside risk. -
Moving Averages:
-
50-day SMA < 200-day SMA → Bearish alignment
-
Confirms that the macro trend remains negative
-
-
Oversold Conditions:
-
Momentum indicators (likely RSI, Stochastics) are in oversold territory, suggesting potential for a short-term rebound or consolidation.
-
Fundamental Backdrop:
-
Demand Concerns:
Intensifying global trade tensions have raised fears of a recession, which could severely dent energy demand. -
Price Action:
Crude has now fallen to levels not seen in nearly four years, adding to panic-driven selling pressure.
Recent News
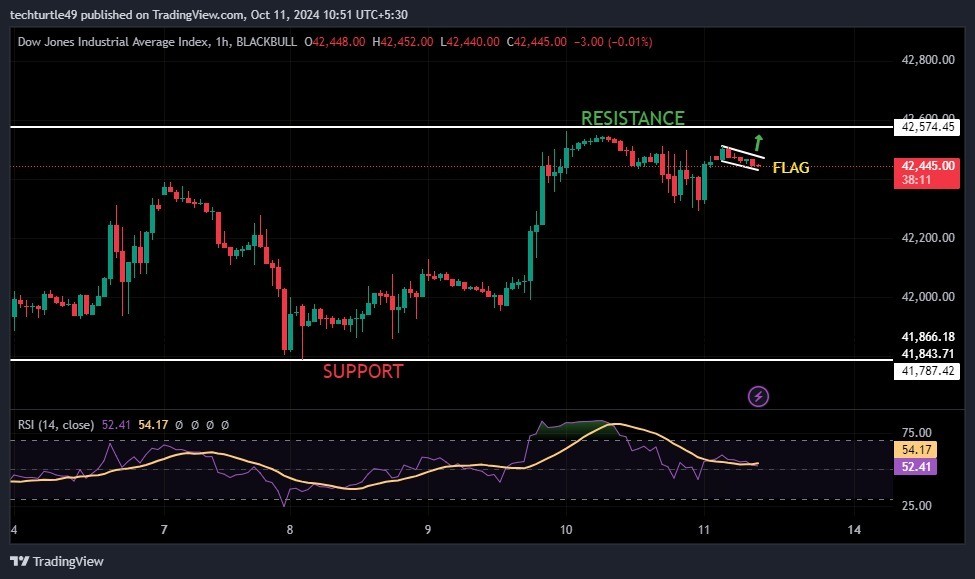
Dow Jones Day's Analysis
October 11, 2024
Market Insights
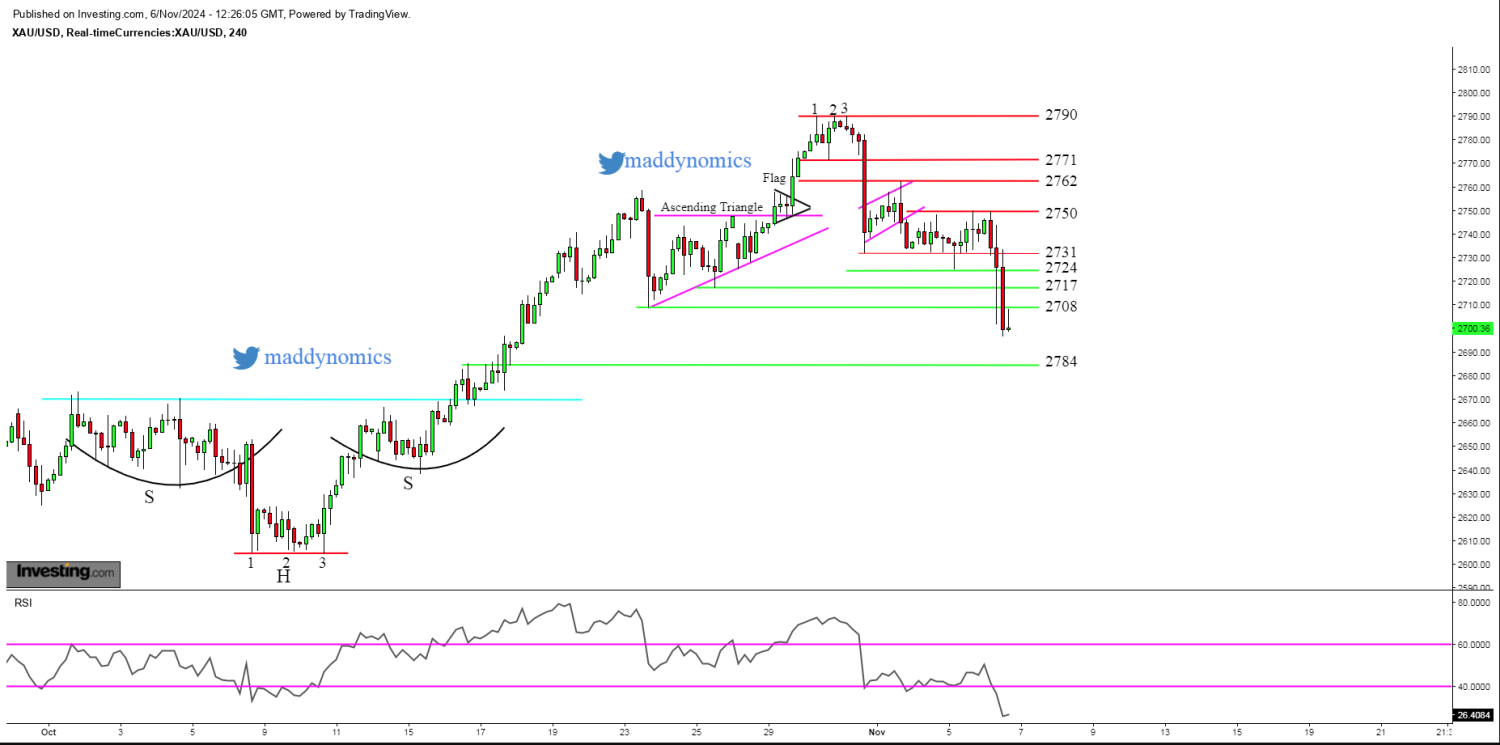
Gold losses its shine as Trump trade ful...
November 06, 2024
Market Insights
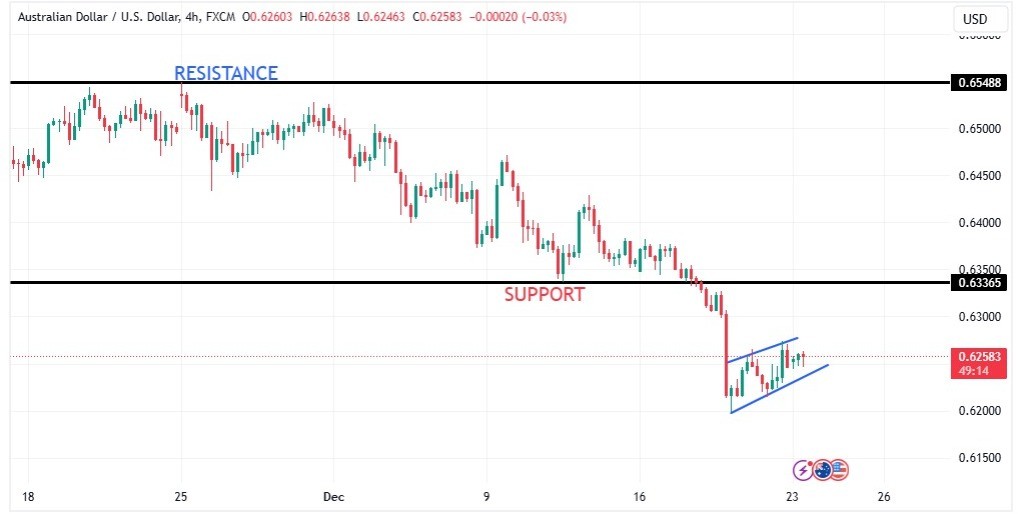
AUDUSD making a wedge pattern
December 23, 2024
Market Insights
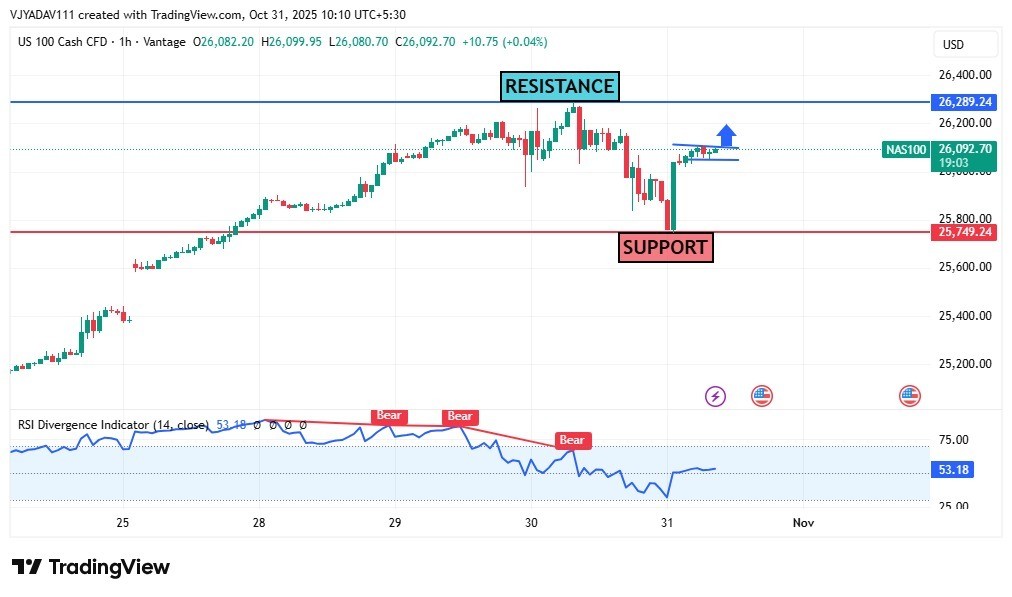
NASDAQ 100 Rebounds from Support, Eyes B...
October 31, 2025
Market Insights
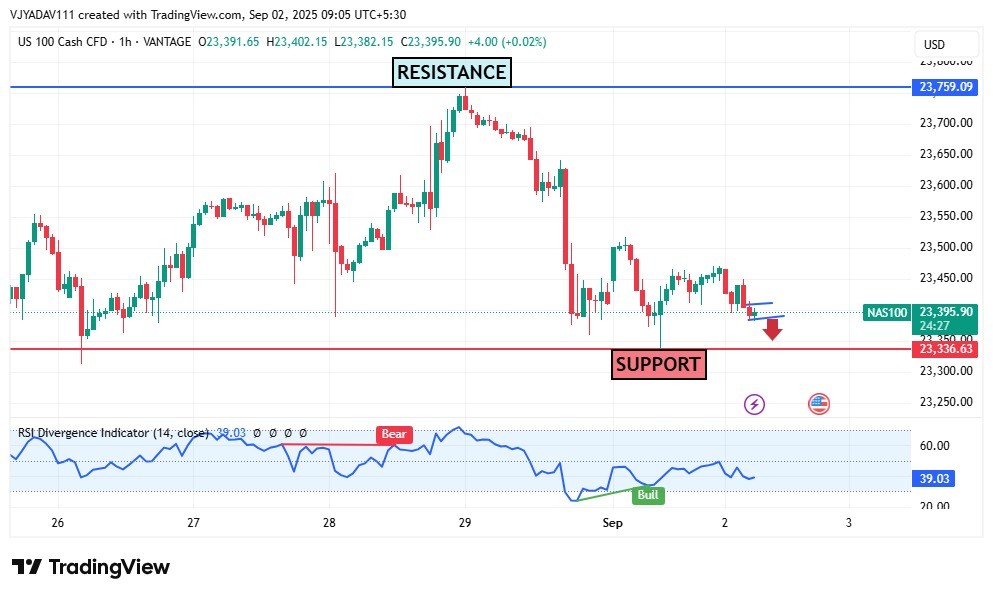
NASDAQ 100 Faces Pressure Near 23,336 Su...
September 02, 2025
Market Insights
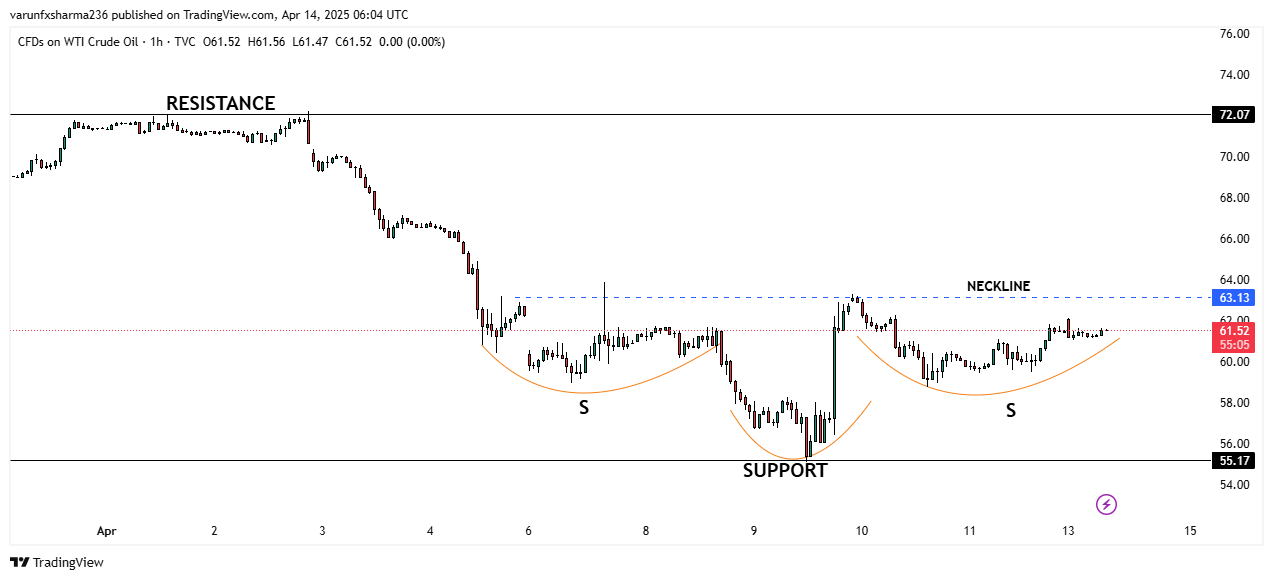
WTI Crude Oil Forms Inverse Head and Sho...
April 14, 2025
Market Insights


