WTI Crude Oil Approaching Key $66–$68 Support Zone: Rebound or Further Decline?
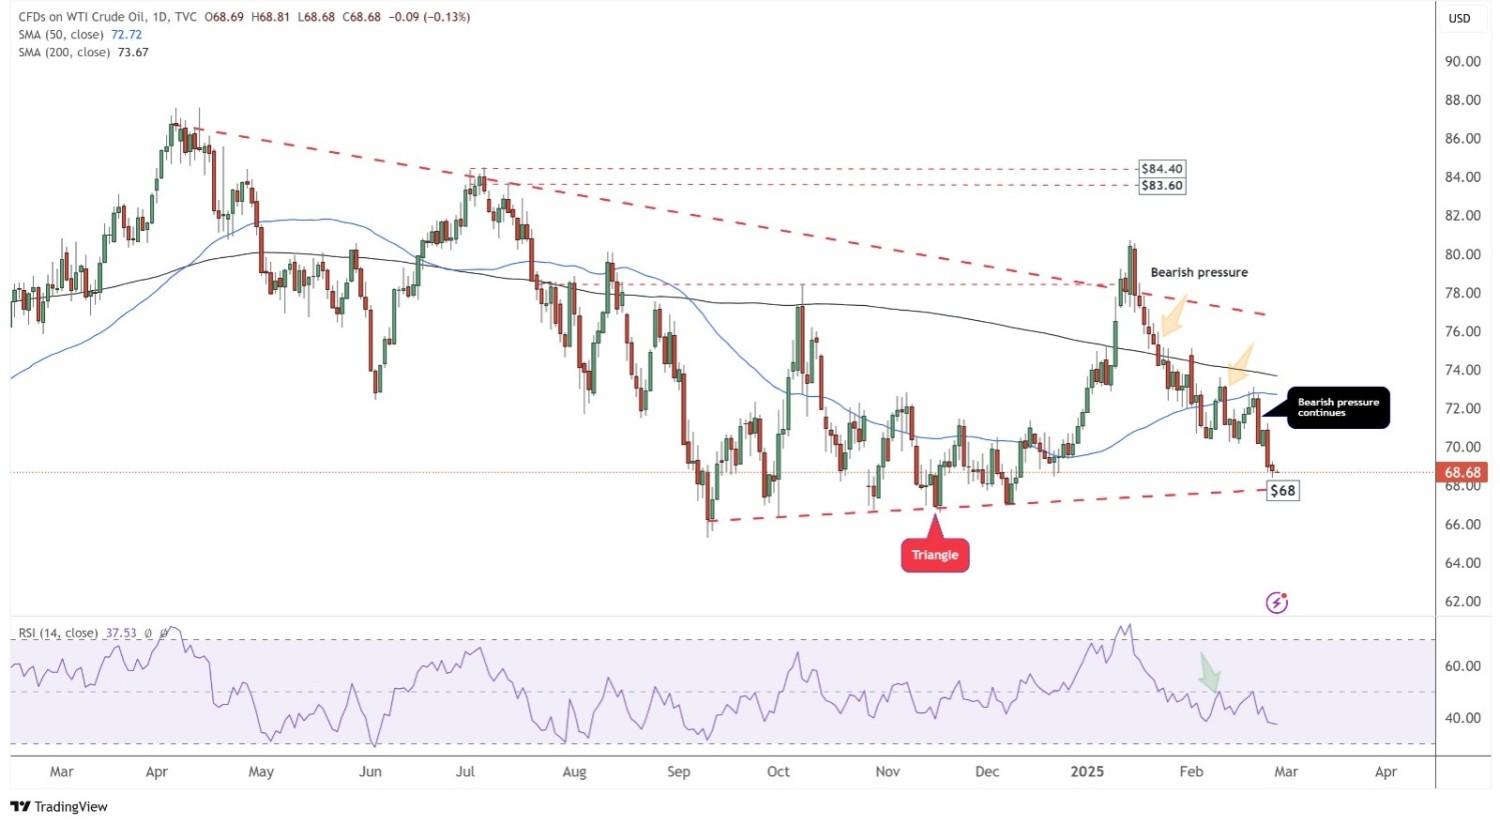
The daily chart for WTI Crude Oil reveals that the price is approaching the $66–$68 support zone, which aligns with the breakdown target of a long-term triangle pattern formed in 2024. This area holds significant technical importance as it previously acted as strong support.
Despite prevailing market uncertainty, a potential rebound from this level is likely. Key factors influencing the next move include:
Recent News
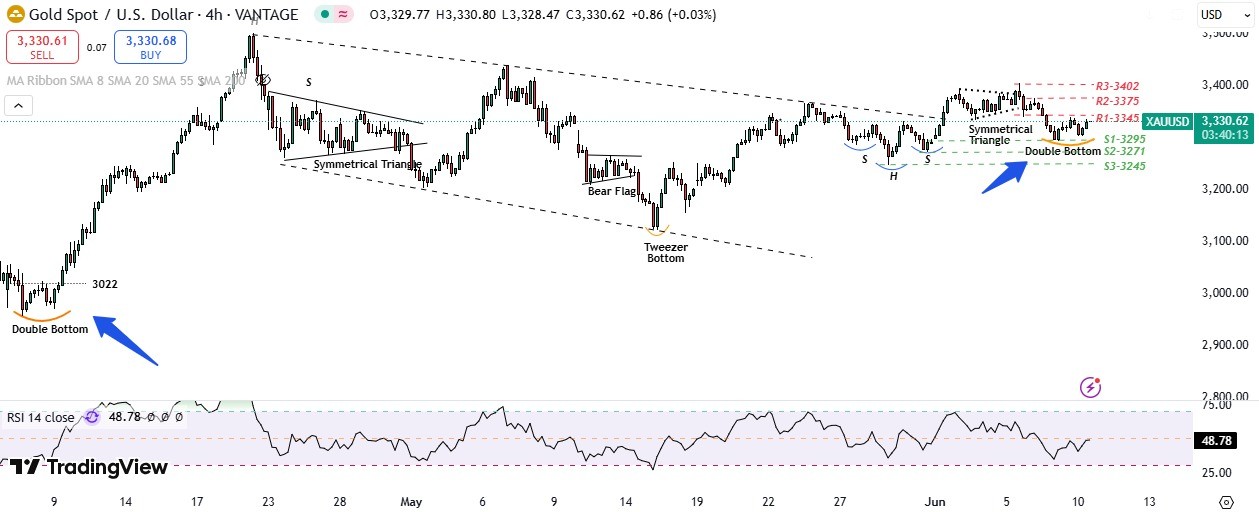
Gold extends gains amid US–China trade t...
June 10, 2025
Market Insights
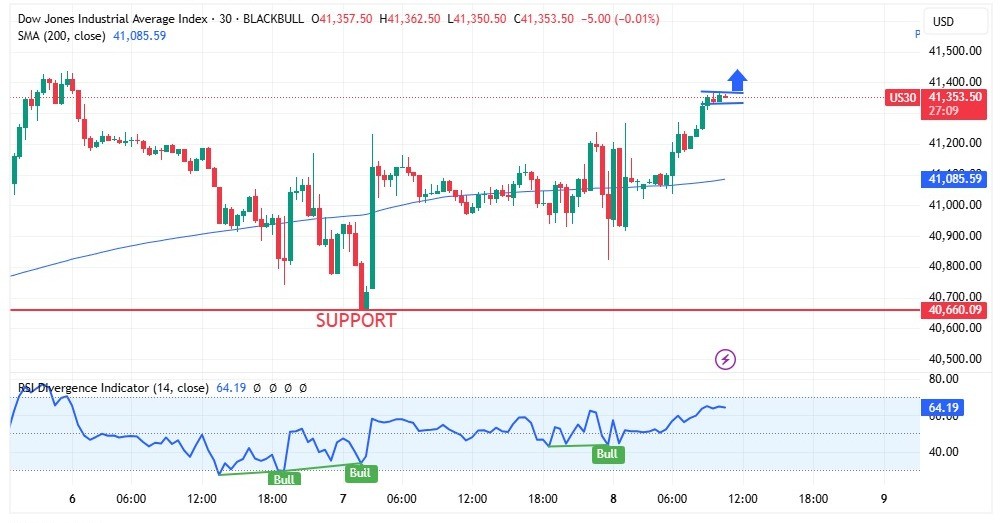
DOW JONES making a Bullish Flag on 1HR t...
May 08, 2025
Market Insights
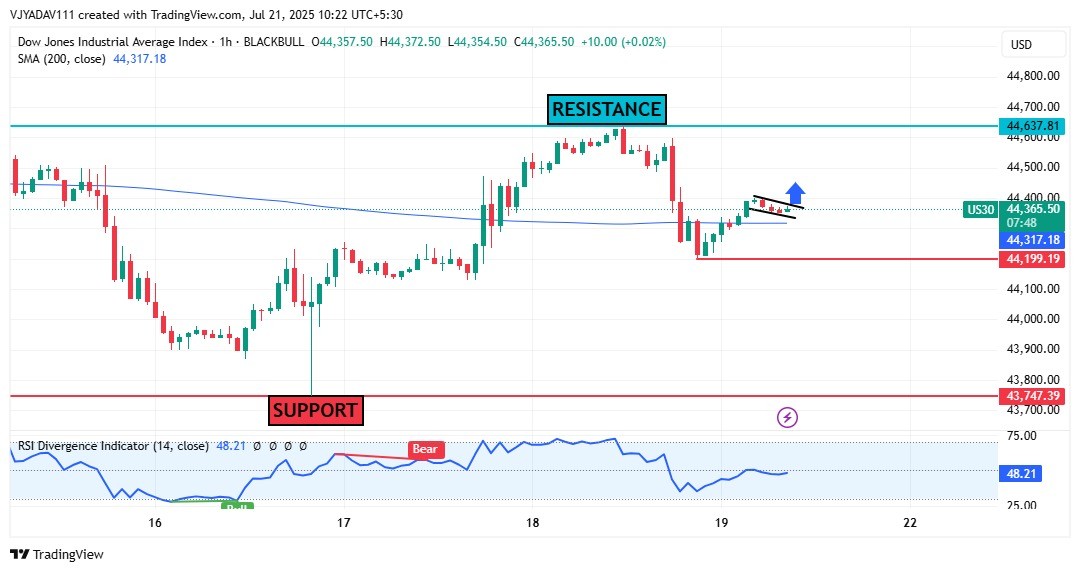
US30 Forms Bullish Flag Above 200 SMA E...
July 21, 2025
Market Insights
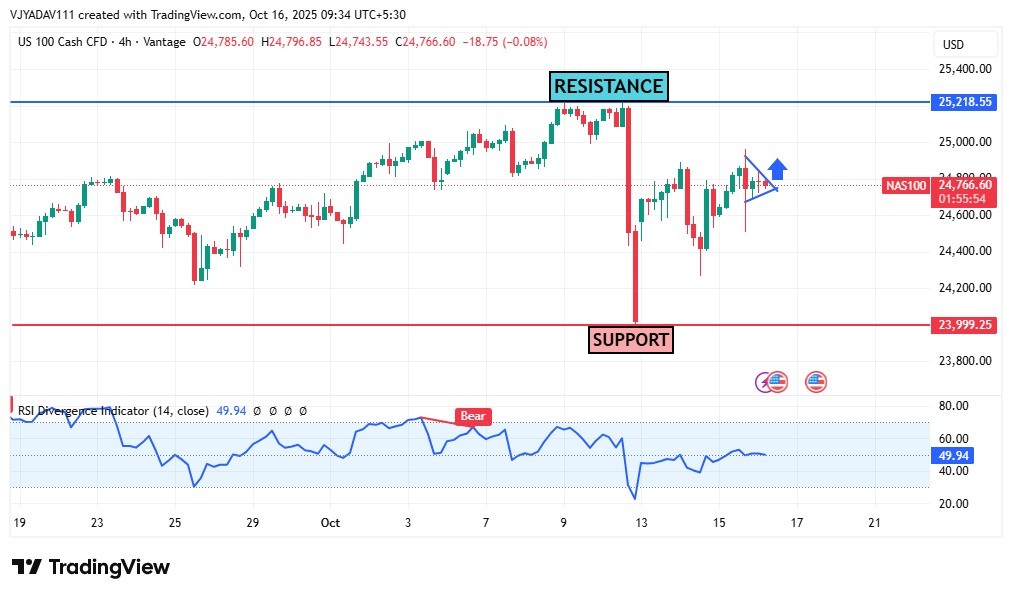
NASDAQ still bull after correction in S&...
October 16, 2025
Market Insights

Oil Prices Extend Losses Amid Recession...
March 11, 2025
Market Insights
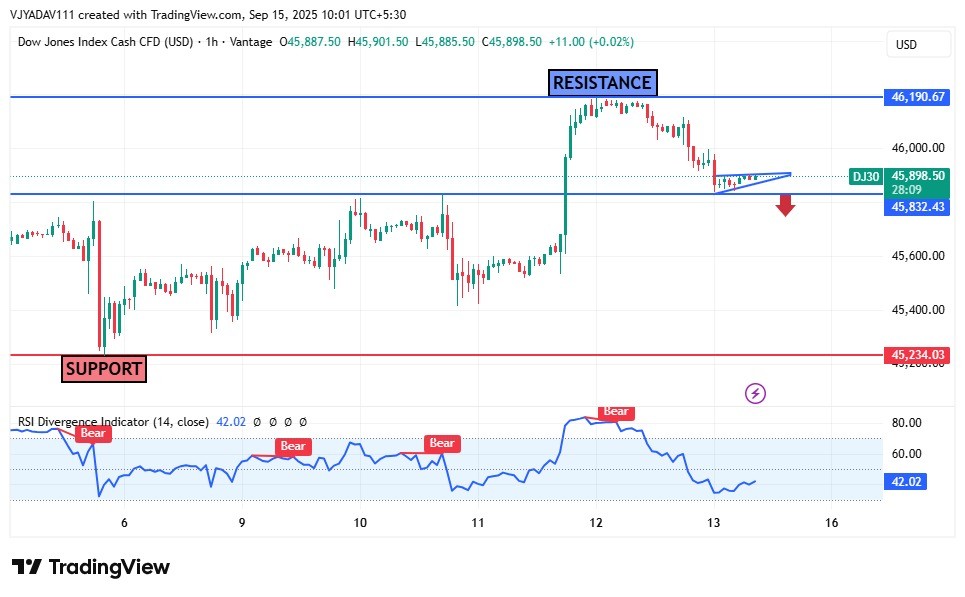
Dow Jones Struggles Below Resistance; Br...
September 15, 2025
Market Insights


