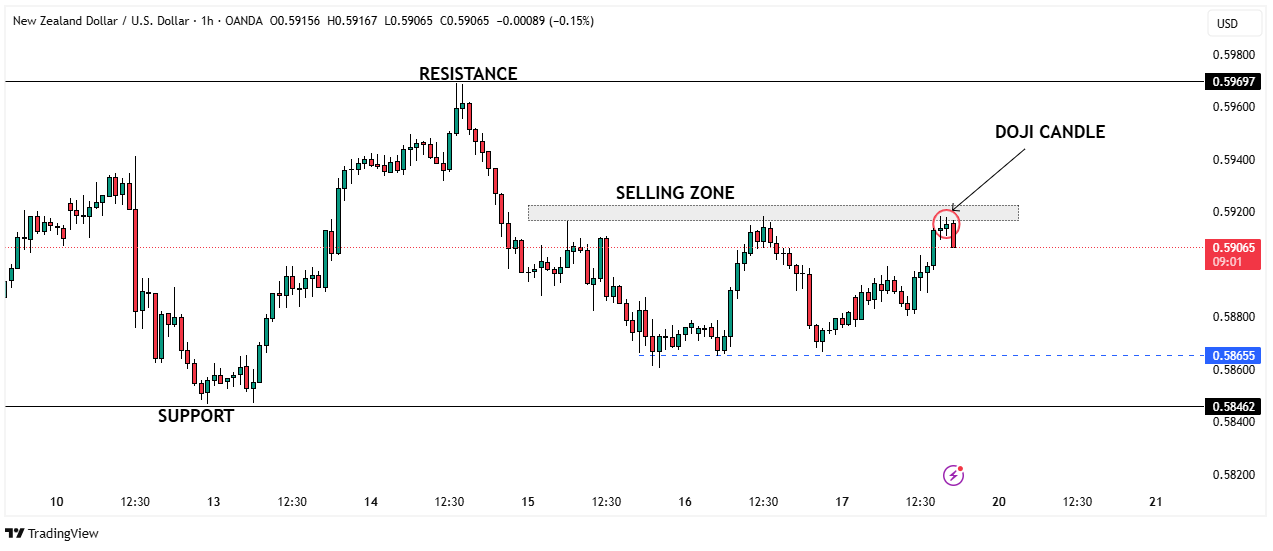
- The NZD/USD pair has approached a critical selling zone between 0.5920 and 0.5940, where historical price action has repeatedly faced resistance. After a strong bullish move, the pair printed a doji candle within this zone, signaling indecision and potential exhaustion of buying momentumThis doji formation—occurring right at a supply zone—can be an early warning of a bearish reversal, especially as it follows a sharp rally. The market appears to respect this zone, which has acted as a strong barrier in the past, turning buyers into sellers. The failure to break above the zone, coupled with the rejection wick on the doji, adds to the bearish bias. If sellers gain control, the pair may decline toward the next key support levels at 0.5865 and 0.5846. A break below these could open the path for further downside. However, if the price manages to break and sustain above the resistance zone (above 0.5940), the bearish view would be invalidated, and the pair could aim for the major resistance near 0.5969.
NZD/USD Rejected at Selling Zone
Recent News
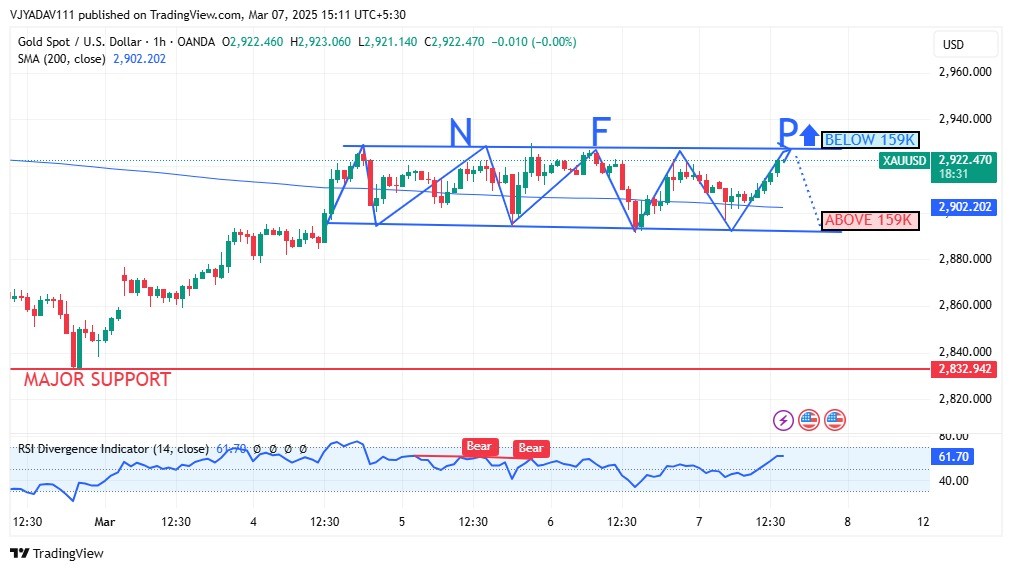
Gold Awaits NFP Breakout Key Levels in F...
March 07, 2025
Market Insights
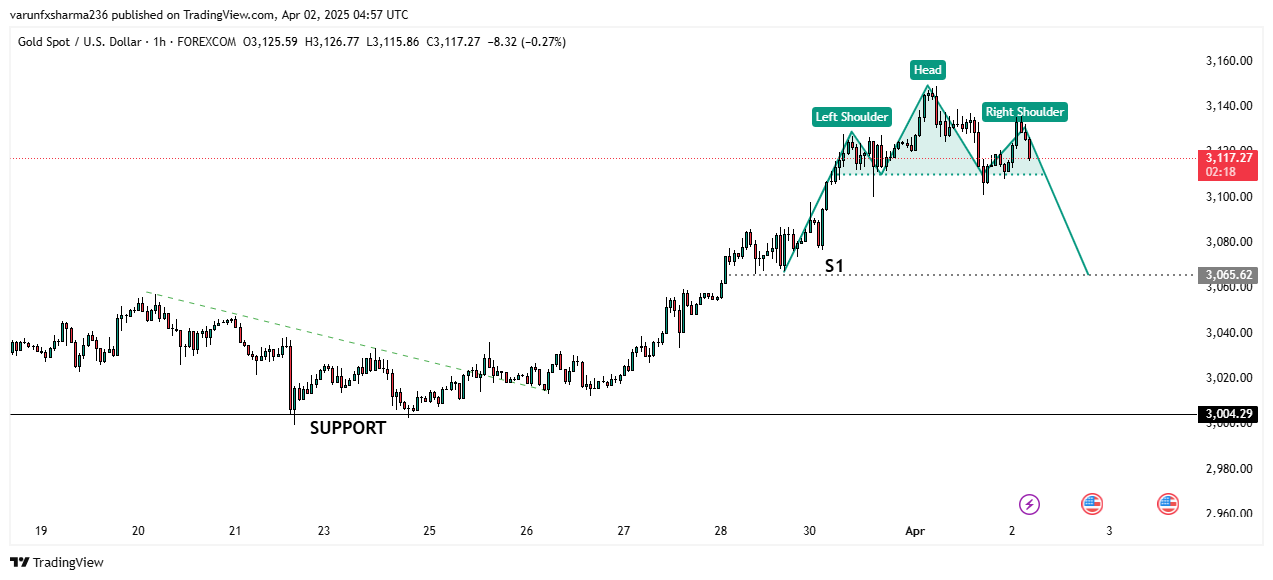
Gold Prices Face Bearish Reversal as Hea...
April 02, 2025
Market Insights
NASDAQ making a Bullish Flag in 1HR time...
May 08, 2025
Market Insights

US Presidential Election: Key Market Imp...
November 05, 2024
Market Insights
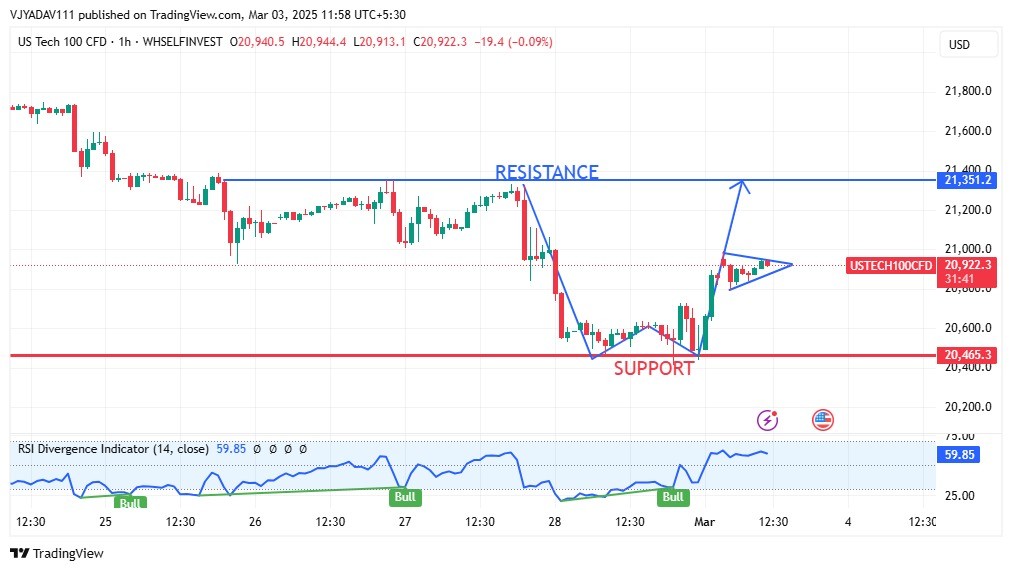
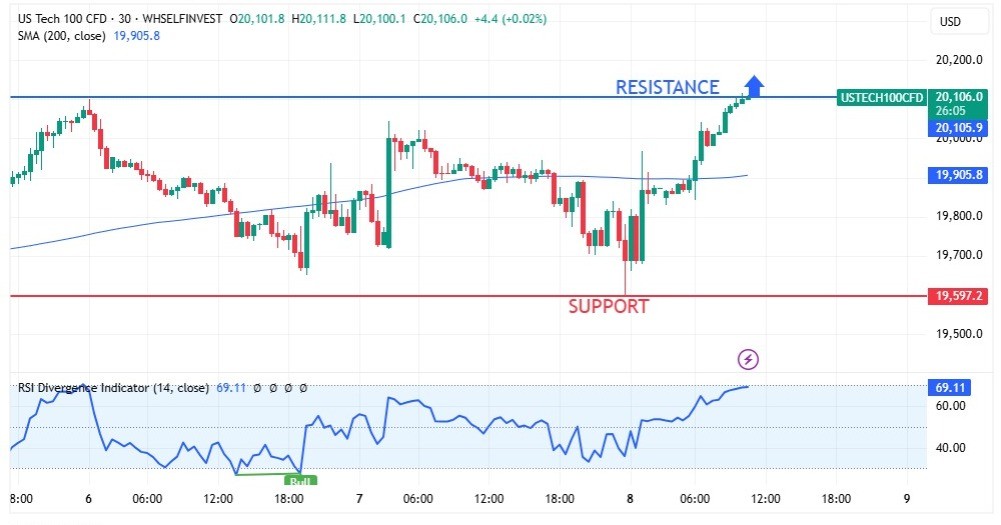
US Tech 100 Chart Breakout Pattern Emerg...
March 03, 2025
Market Insights
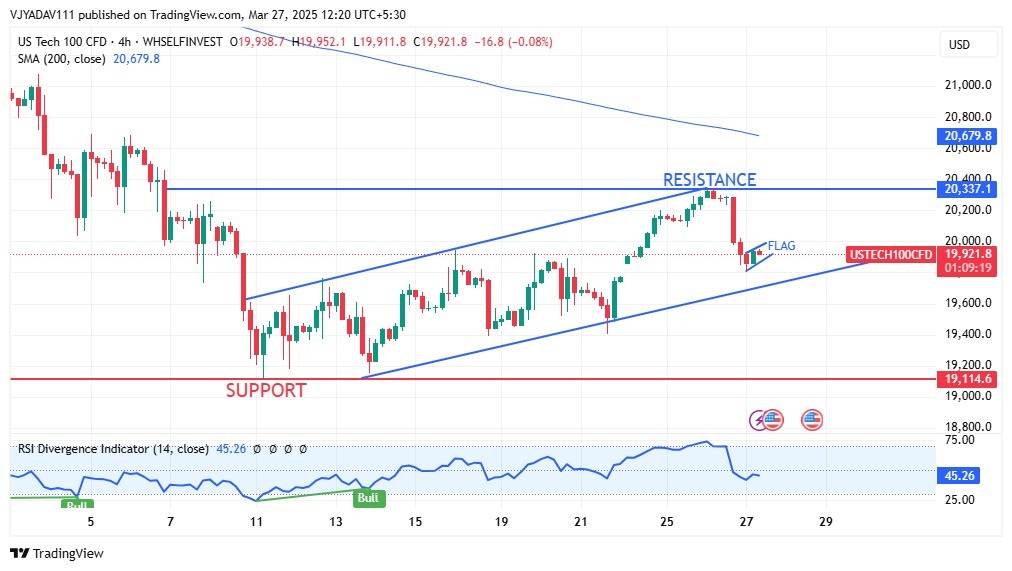
US Tech 100 forms a bearish flag near 19...
March 27, 2025
Market Insights


