Gold wiped off gains in the early Asian session ahead of US NFP report
XAU/USD Technical Overview:
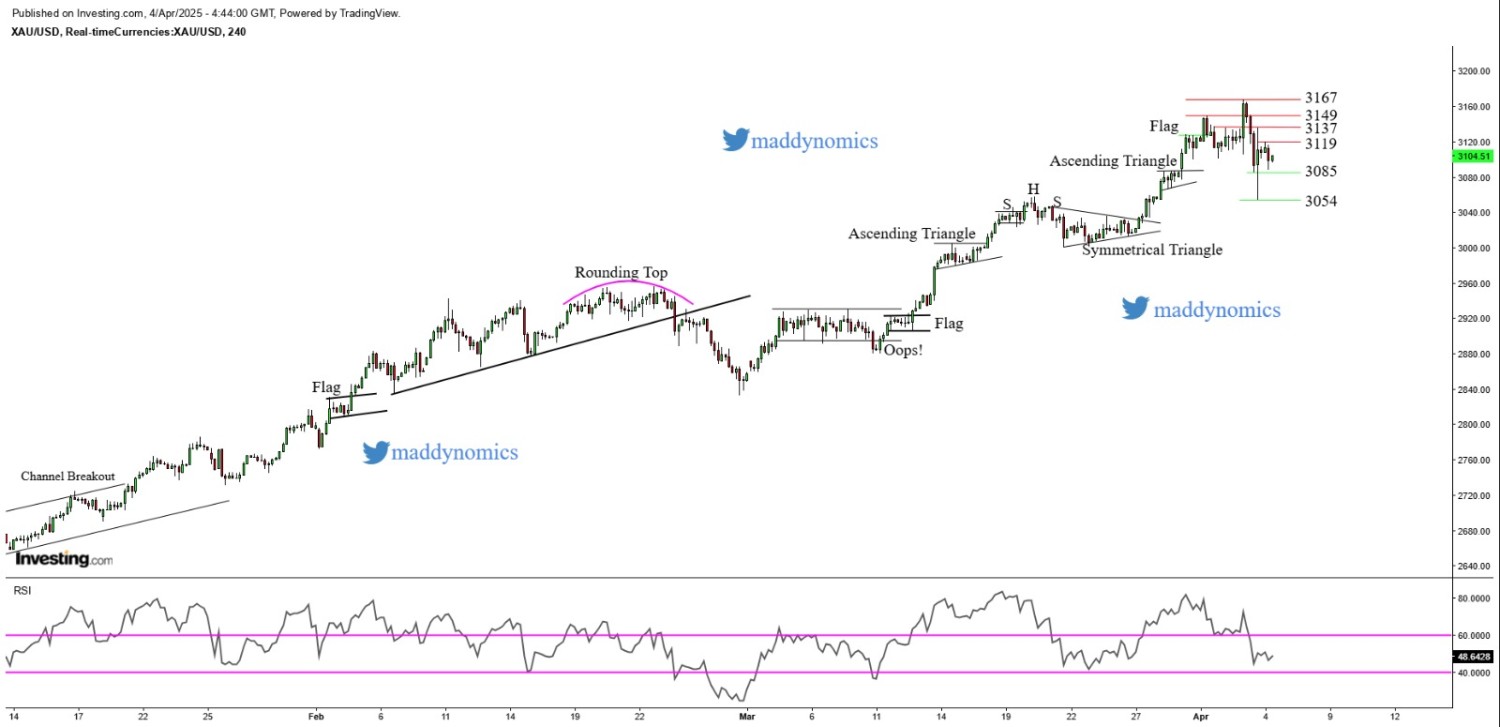
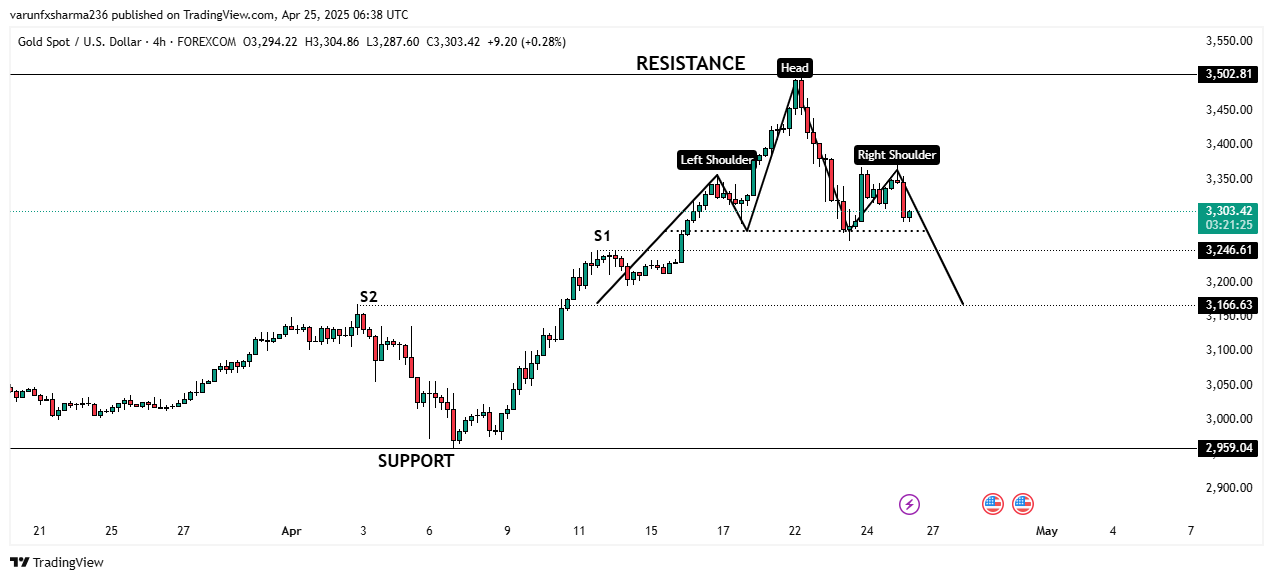
After a modest decline from $3135, Gold is displaying mixed signals across multiple timeframes as prices consolidate near $3100 at the time of writing. On the daily chart, a High Wave candlestick reflects market indecision near recent highs. The 4-hour chart shows price is trading below the 20 SMA suggesting short-term bearish pressure.
Intraday Strategy:
The trend remains neutral, with a strategy favouring buying near key supports and selling at resistance zones.
Weekly Outlook:
The broader weekly trend remains extremely bullish though there are early signs the prices may enter into a corrective phase or consolidation.
Key Levels:
-
Resistance: 3108, 3120, 3135
-
Support: 3087, 3076, 3055
FUNDAMENTAL OVERVIEW
Following some profit-taking, Gold re-established strength to $3135 in the late American session on Thursday however prices registered mild losses in Friday's early session. Despite facing selling pressure, several factors are likely to lend support to the yellow metal and limit downside risk.
Markets were shaken after US President Donald Trump announced new reciprocal tariffs of at least 10% on all imports, raising concerns about a global economic slowdown.
In response, traders increased bets that the Federal Reserve will restart rate cuts in June and deliver up to four reductions by year-end as recession fears grow due to Trump’s trade stance.
Market focus now shifts to the US March jobs report due Friday, featuring key data such as Nonfarm Payrolls (NFP), the Unemployment Rate and Average Hourly Earnings.
Recent News
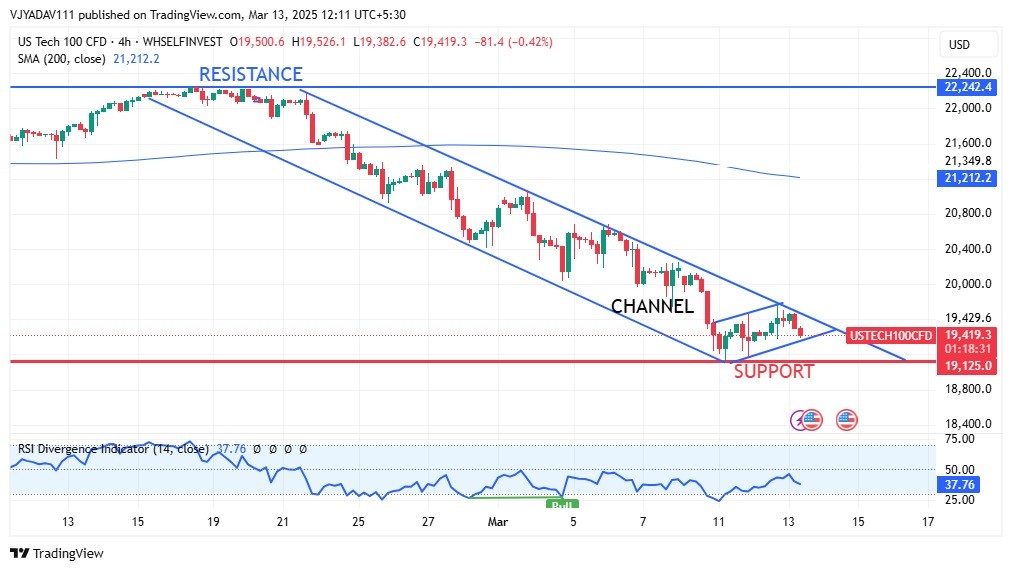
Nasdaq 100 Approaching Key Support Zone...
March 13, 2025
Market Insights
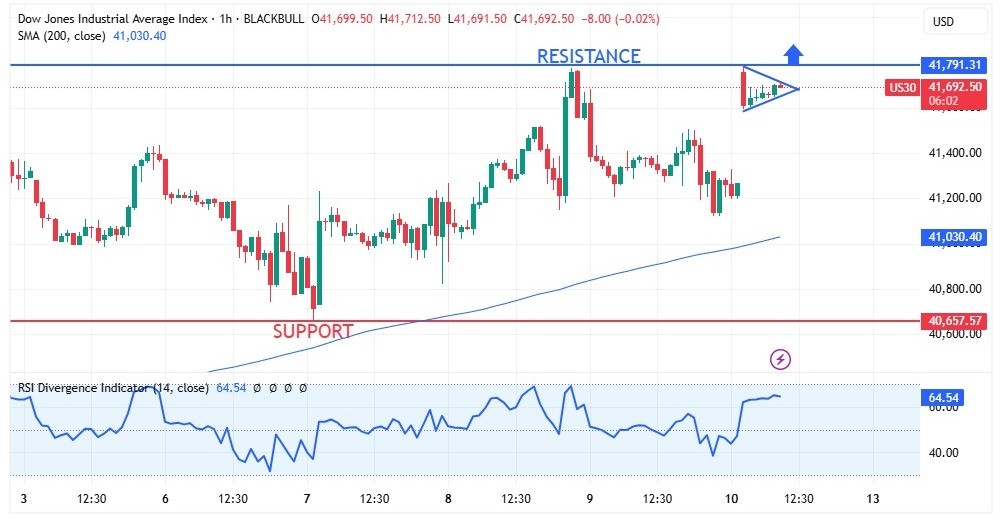
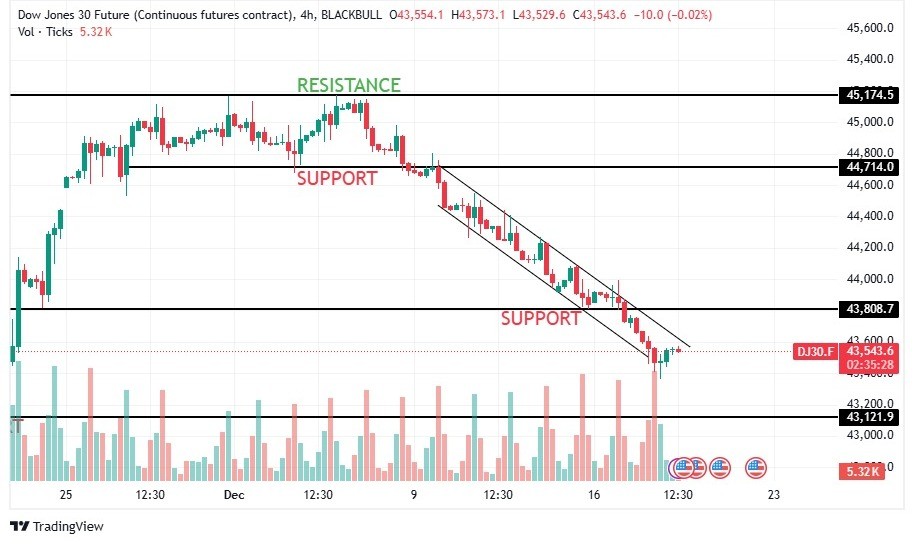
DOW JONES making a pennant pattern on re...
May 12, 2025
Market Insights
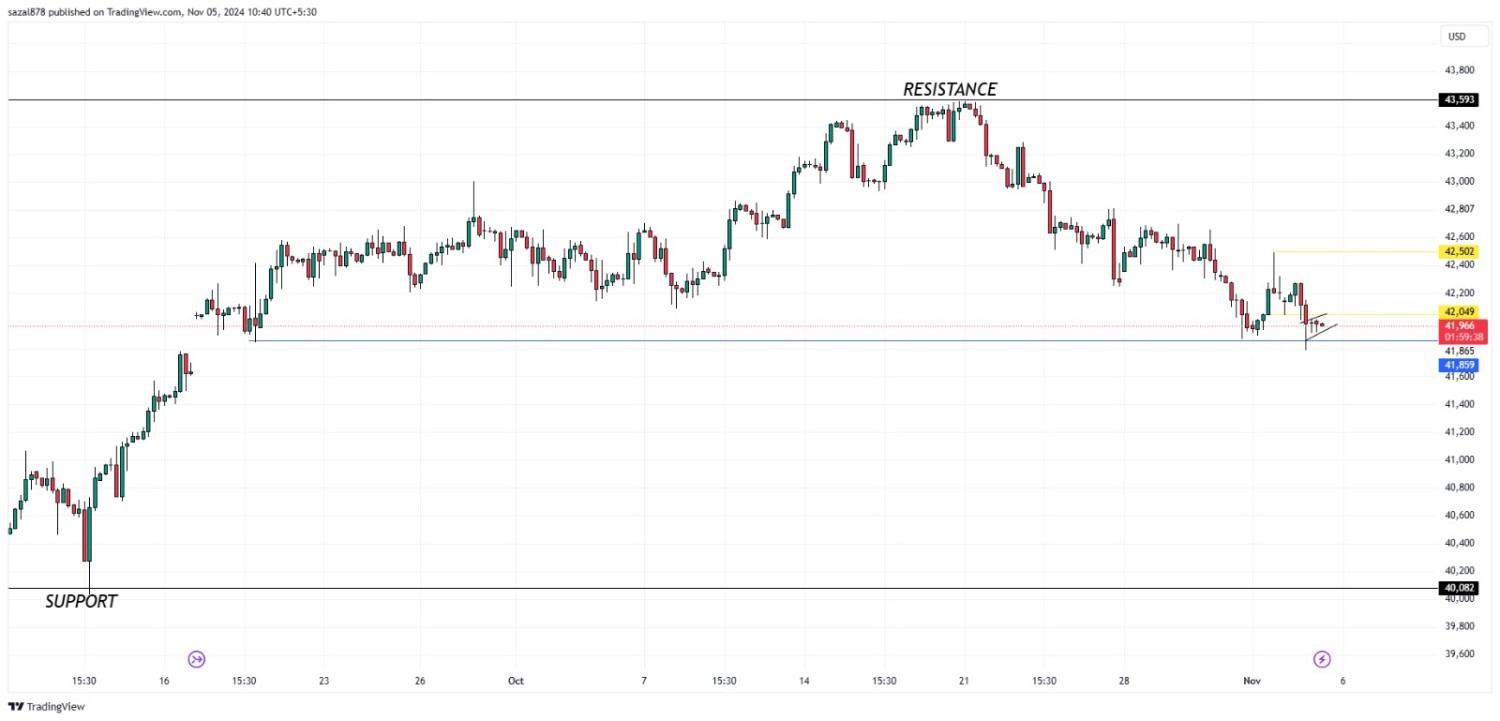
DOW JONES ANALYISIS
November 05, 2024
Market Insights
Gold Stumbles as Trade Tensions Ease: He...
April 25, 2025
Market Insights
Dow Jones Industrial Average ends Tuesda...
December 18, 2024
Live Charts
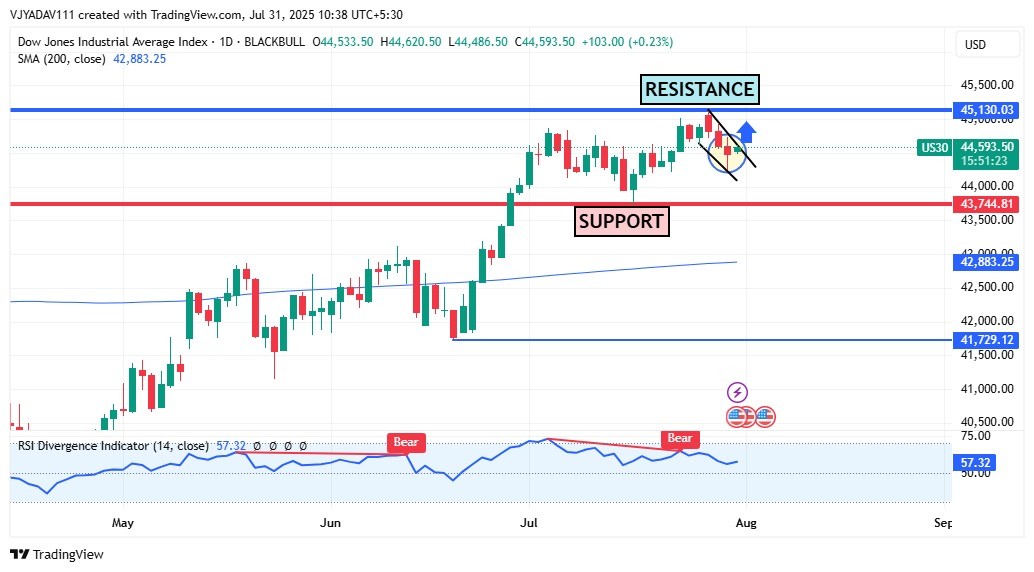
US30 Breakout Watch: Bullish Flag Near R...
July 31, 2025
Market Insights


