Gold trading near ATH, Bulls are waiting for breakout.
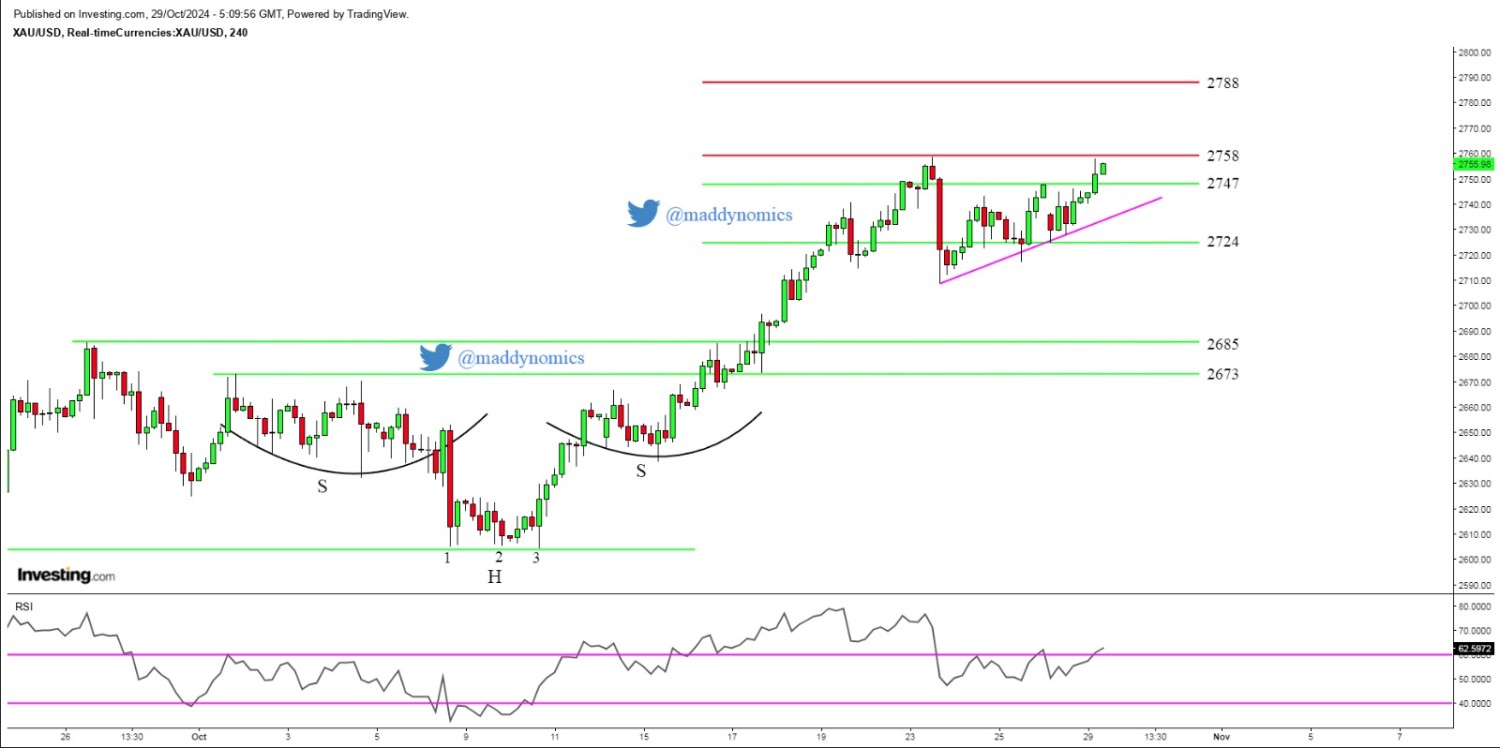
After 6 days of rangebound movement, Gold Bulls are back & looking for a Breakout on Daily Chart. In early asian session Gold gave a breakout from 1hr Flag Pattern & currently trading at 2753 at the time of writing this report. On 4hr Time frame it has formed an ascending triangle pattern which is bullish in nature. Dollar Index & Bond Yields are consolidating attracting fresh buyers in Gold. Meanwhile, increased enthusiasm that former US President Donald Trump could win the November 5 election, combined with hopes of more Chinese stimulus, underpin global equities, diminishing the attractiveness of the go-to safe-haven, the US Dollar.
Traders today will be waiting for CB Consumer Confidence data alongside JOLTS Job Openings.
Gold Structure: Inside Bar Breakout on Daily, Near Flag Breakout on Daily, Ascending Triangle Pattern on 4hr, Breakout from flag on 1hr.
Intraday Strategy/ Intraday Trend: Buy on Support,Buy on Breakouts/ Bullish
Weekly Trend: Hyper Bullish
Major Resistance: 2758,Undefined, Undefined
Major Support: 2747,2740,2730
Recent News
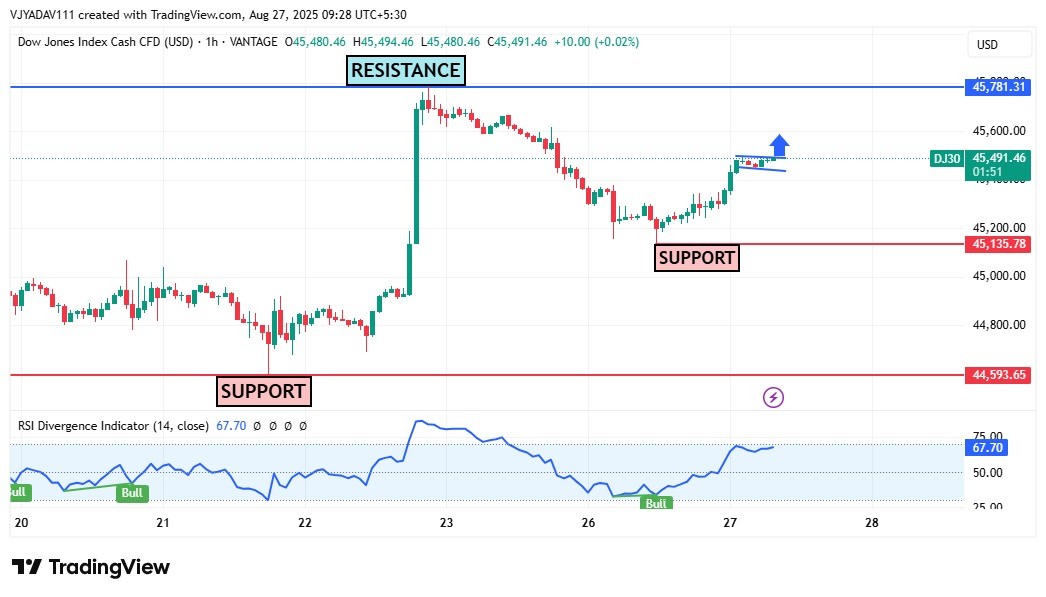
Dow Jones Index Rebounds from Support, E...
August 27, 2025
Market Insights
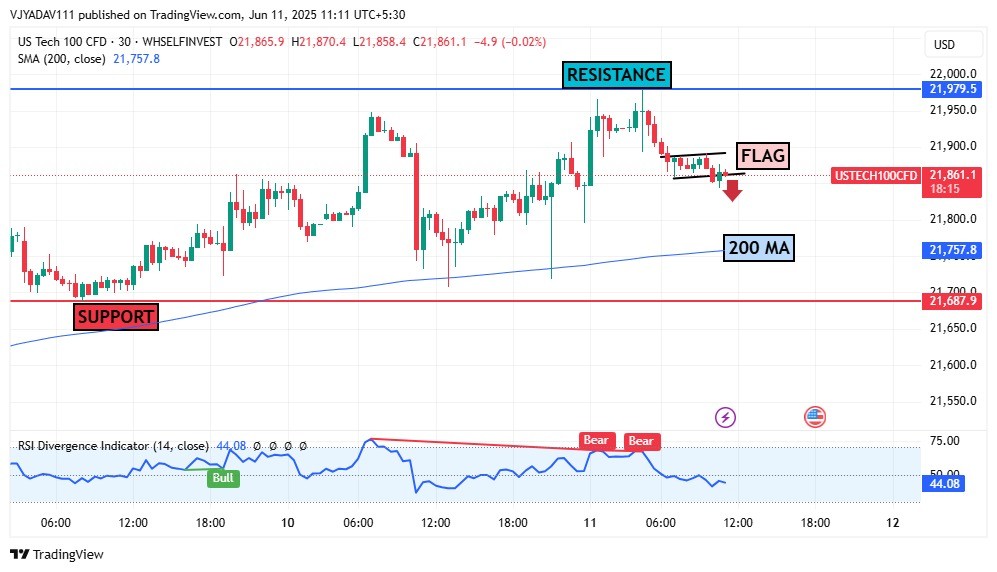
US Tech 100 Bearish Flag Near Resistance...
June 11, 2025
Market Insights
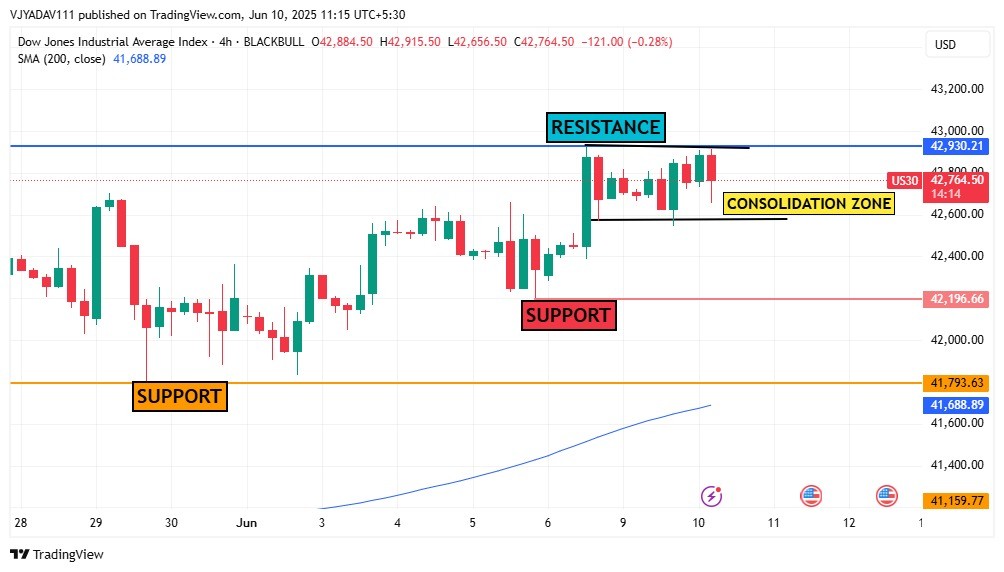
US30 Consolidates Between Key Resistance...
June 10, 2025
Market Insights
Gold witnesses modest recovery ahead of...
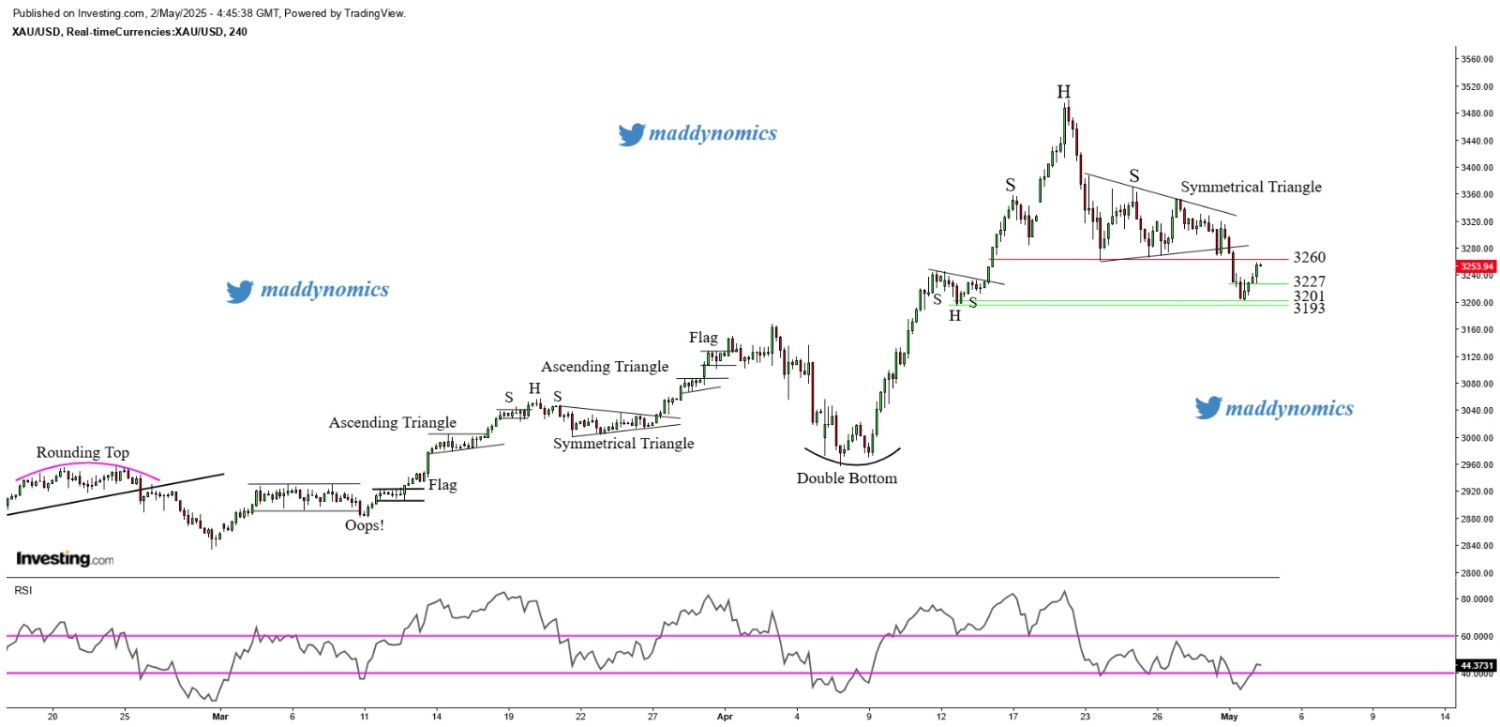
May 02, 2025
Market Insights
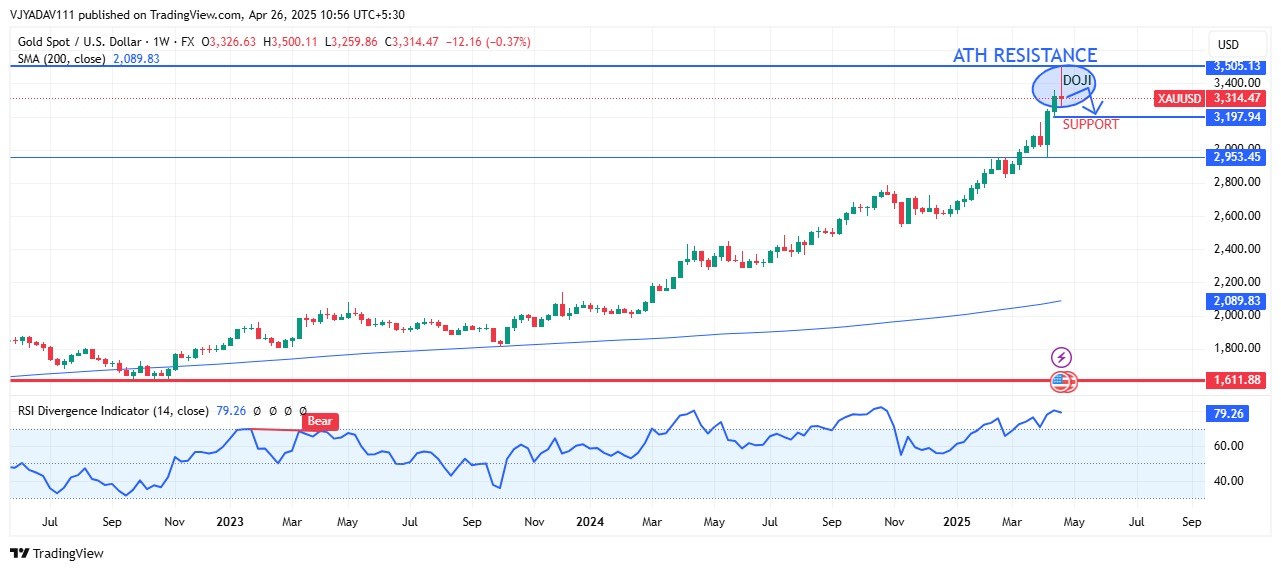
GOLD TESTS ALL TIME HIGH RESISTANCE NEAR...
April 26, 2025
Market Insights
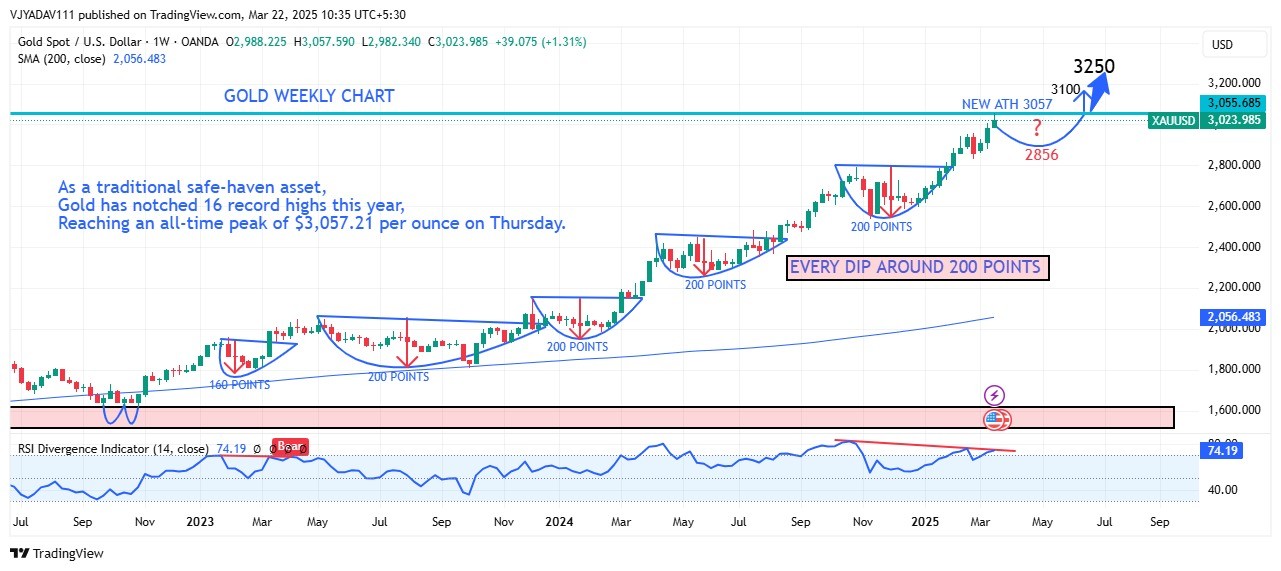
Gold Surges to Historic High of $3,057 A...
March 22, 2025
Market Insights


