Gold trades in a narrow range, oscillating between modest gains and losses ahead of key US CPI release
Gold fell sharply by 1.65% on Monday as easing geopolitical tensions and renewed USD strength pressured safe-haven demand. Hopes for progress at Friday’s US–Russia summit on Ukraine, along with Trump’s three-month extension of the US–China trade truce and assurance that gold will not face tariffs, weighed further on prices.
Despite recent USD gains, weak US economic data and rising expectations for September and year-end Fed rate cuts lent some support to gold in Tuesday’s Asian session. Traders remain cautious ahead of key US inflation data, with PPI, retail sales, consumer sentiment, and multiple Fed speeches later this week likely to influence XAU/USD’s near-term direction.
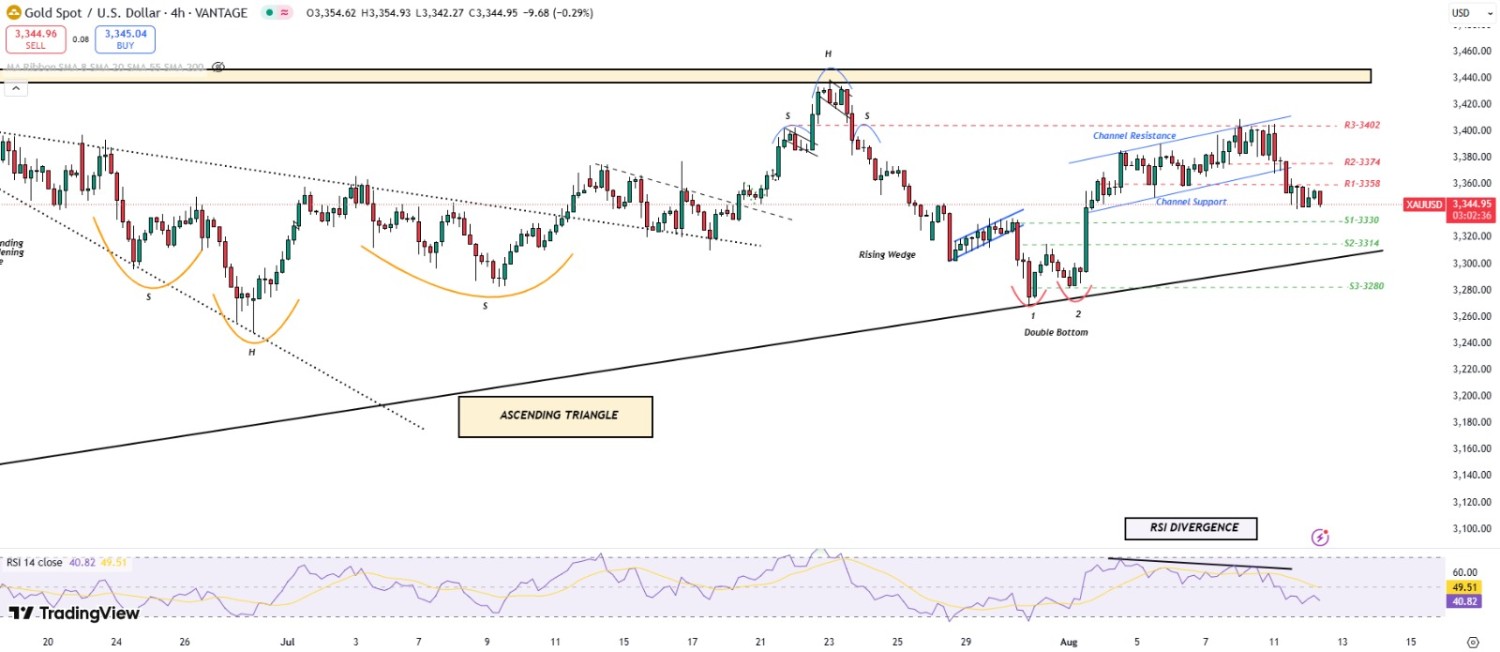
XAU/USD TECHNICAL OVERVIEW
Technical Structure: Gold posted a strong bearish candle on the daily chart, closing just below the 20-SMA, signaling short-term weakness. However, on the 4-hour chart, prices are taking support from the 200-SMA, indicating potential downside cushioning. The 1-hour chart reveals a bullish flag formation, suggesting the possibility of an upside breakout if momentum returns.
Weekly Trend: Neutral
Intraday Trend/ Intraday Strategy: The intraday bias is bullish to neutral, favoring buy-on-breakout or buy-on-support strategies.
Major Support: 3330, 3314, 3300
Major Resistance: 3358, 3374, 3402
Recent News
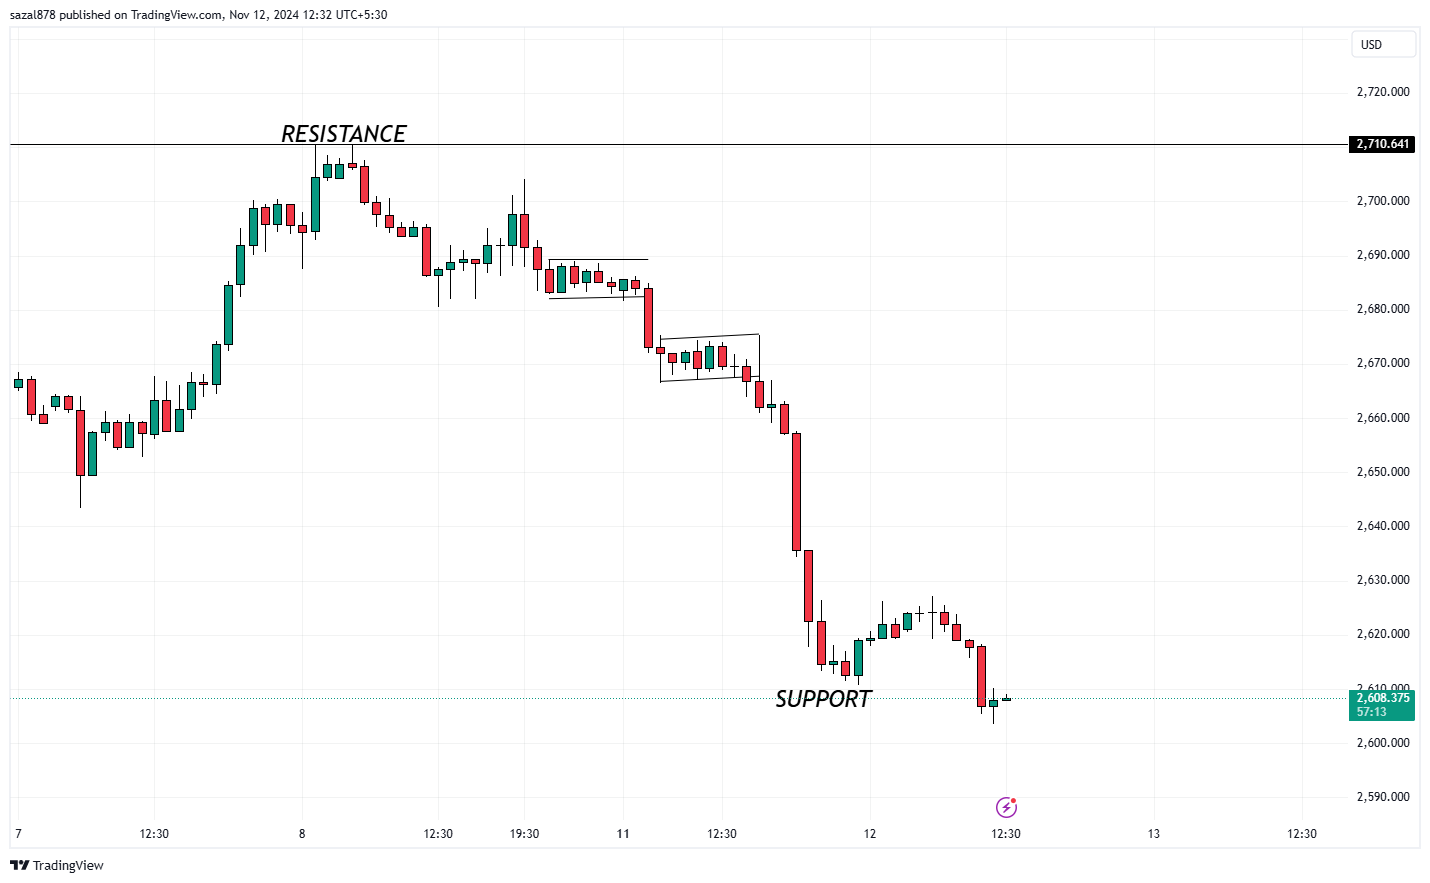
Gold Slips to One-Month Low Amid Strong...
November 12, 2024
Live Charts
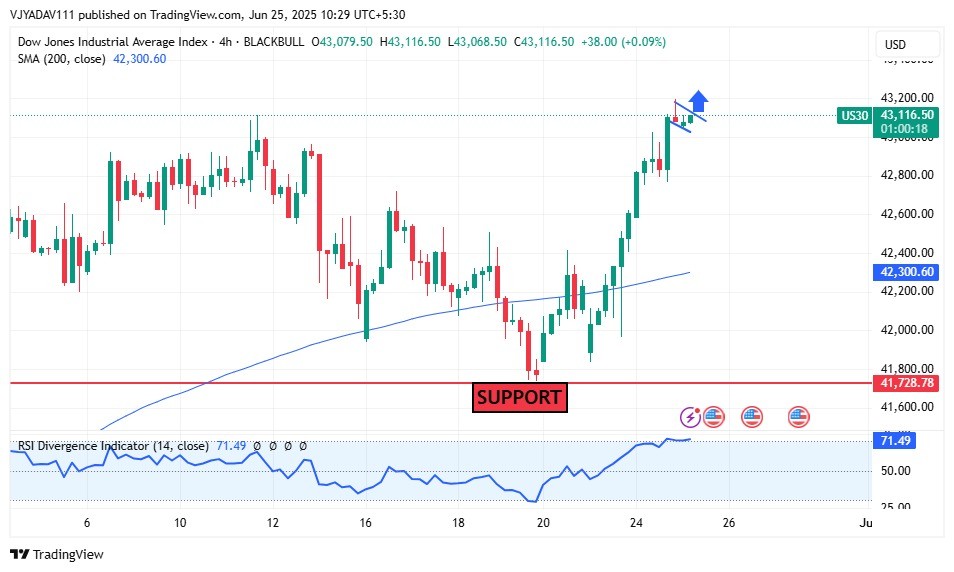
Dow Jones Momentum Surges Bulls Push Bey...
June 25, 2025
Market Insights
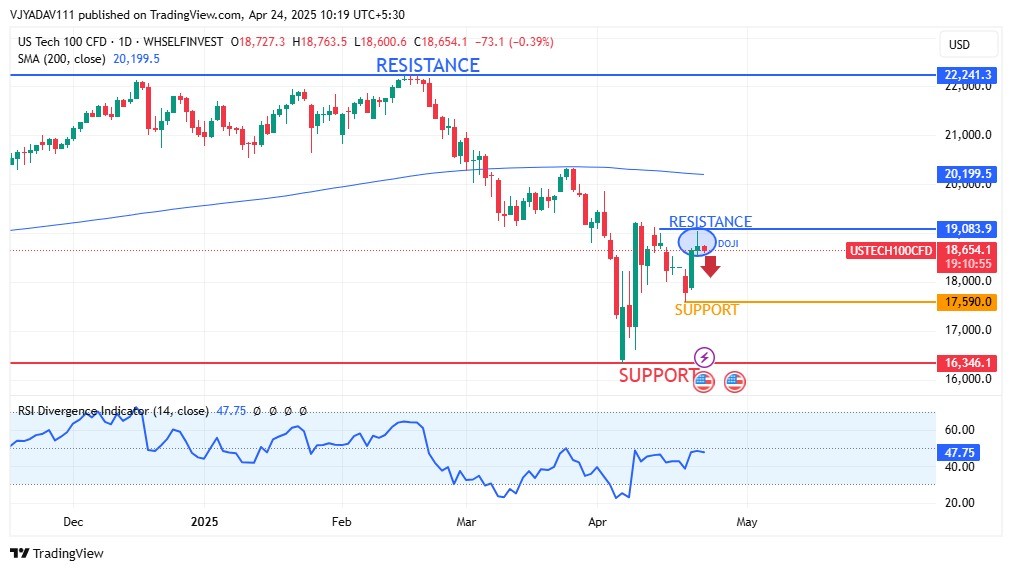
Nasdaq 100 Under Pressure Resistance at...
April 24, 2025
Market Insights
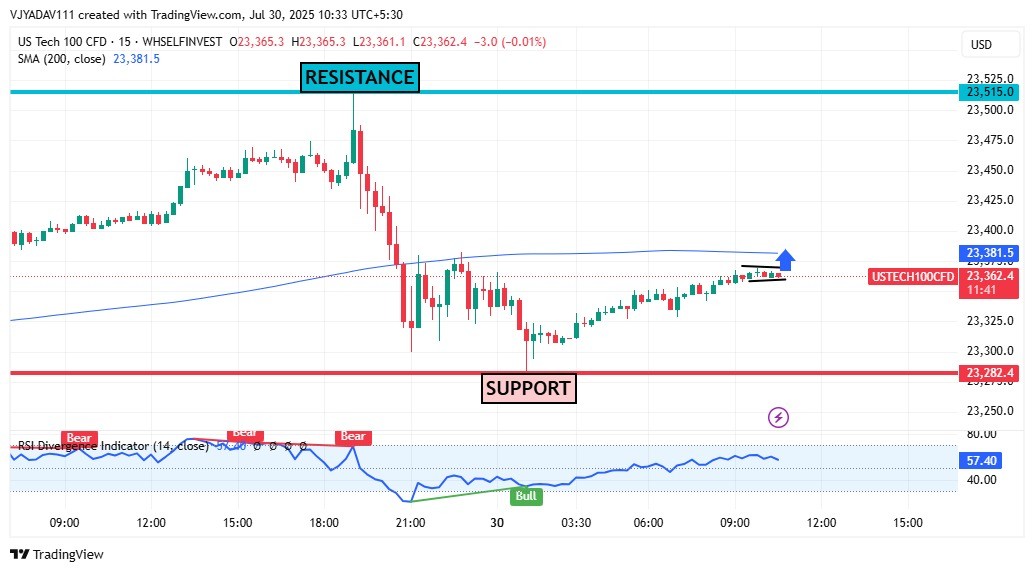
US100 Eyes 200-SMA Breakout – Bullish Mo...
July 30, 2025
Market Insights
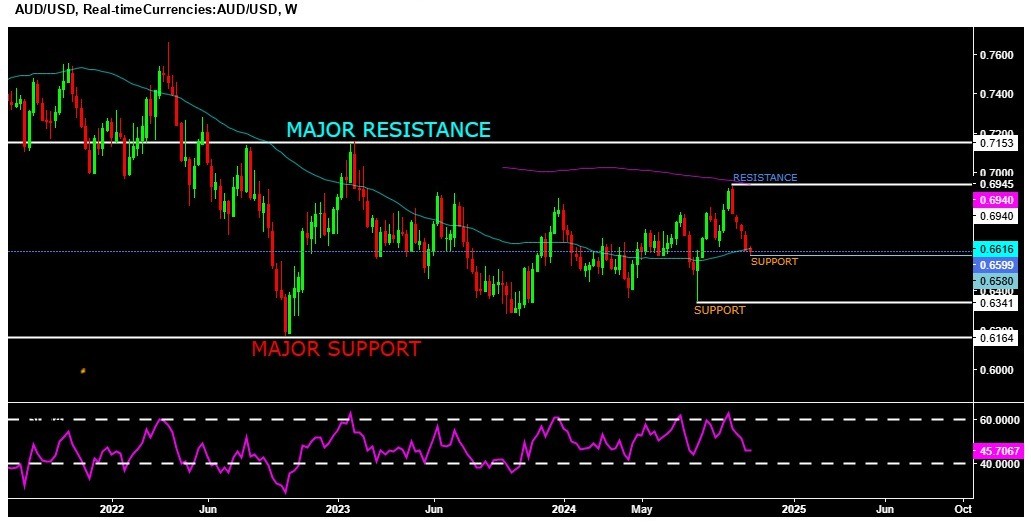
AUDUSD trading at oversold range as per...
October 28, 2024
Market Insights
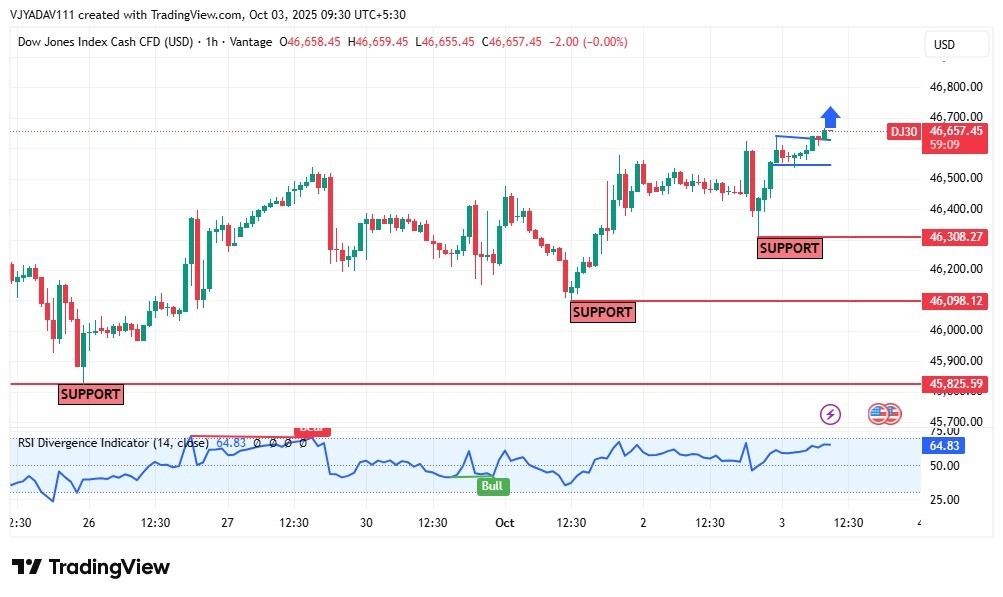
DOW JONES near ATH levels must watch dai...
October 03, 2025
Market Insights


