Gold tests the Top – Breakout from Descending Broadening Wedge on Watch
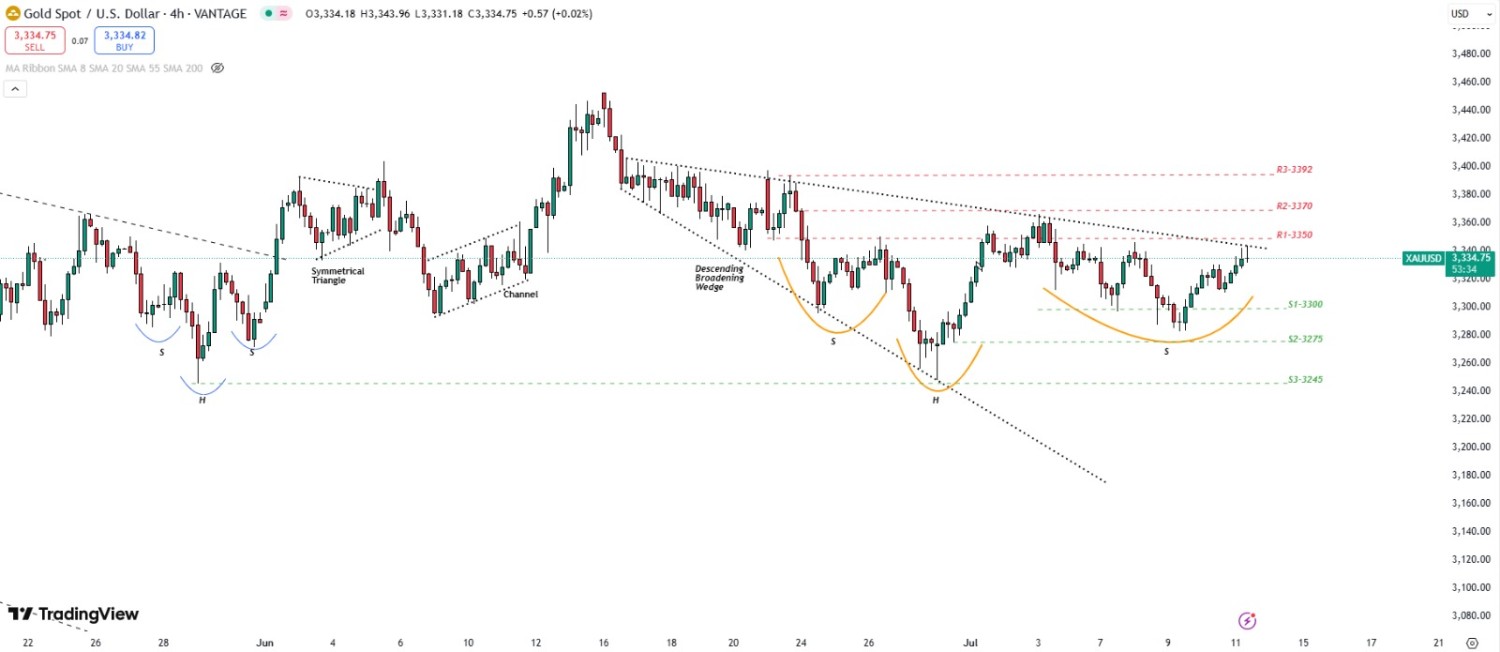
Gold extended its gains for the third consecutive session on Friday, climbing above the $3,340 mark and trading close to the weekly high. The rally is largely fueled by safe-haven demand amid escalating global trade tensions, following US President Donald Trump's latest tariff threats. Despite a stronger US Dollar, risk-off sentiment remains the dominant driver, as investors seek protection from market uncertainty, boosting gold’s appeal.
Meanwhile, the upside momentum in gold remains resilient despite reduced expectations for an immediate Fed rate cut. While traders have dialed back rate cut bets due to fears that tariffs could stoke inflation, the non-yielding metal continues to attract buyers. A firm dollar has had limited impact on gold’s bullish bias, suggesting that geopolitical fears are outweighing monetary concerns in the short term.
XAU/USD TECHNICAL OVERVIEW
Technical Structure: Gold is currently testing the weekly high at the resistance level of descending broadening wedge it has been consolidating in. On the daily chart, price action is contained within a bearish inside bar, signaling short term indecision, while it also continues to trade just below the 20-day SMA, indicating resistance pressure. However, the 4-hour chart shows consolidation and the 1-hour timeframe has formed a bullish flag pattern, suggesting a potential continuation of the recent upward move if breakout levels are cleared.
Weekly Trend: Neutral
Intraday Trend/ Intraday Strategy: The intraday bias remains bullish and favours the strategy of Buying on Breakouts and Buying on Dips
Major Support: 3328, 3300, 3290
Major Resistance: 3345, 3360, 3370
Recent News
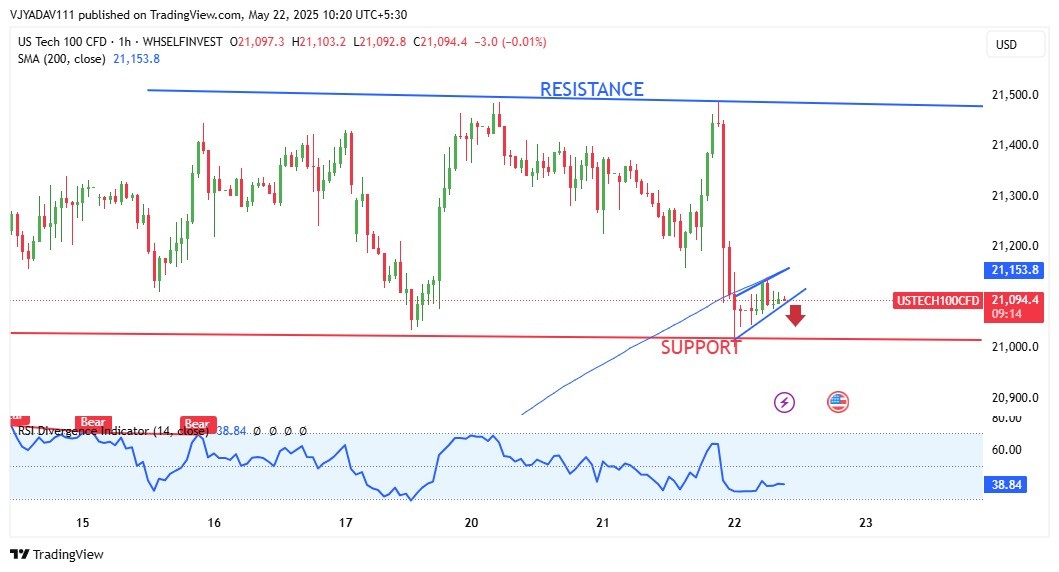
US Tech 100 at a Critical Support Zone W...
May 22, 2025
Market Insights
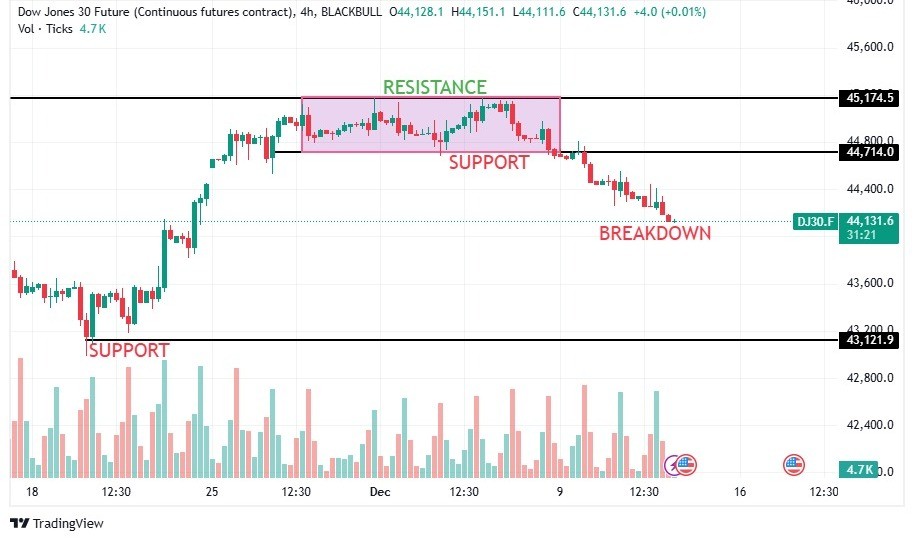
Dow Jones Industrial Average waffles aft...
December 12, 2024
Live Charts
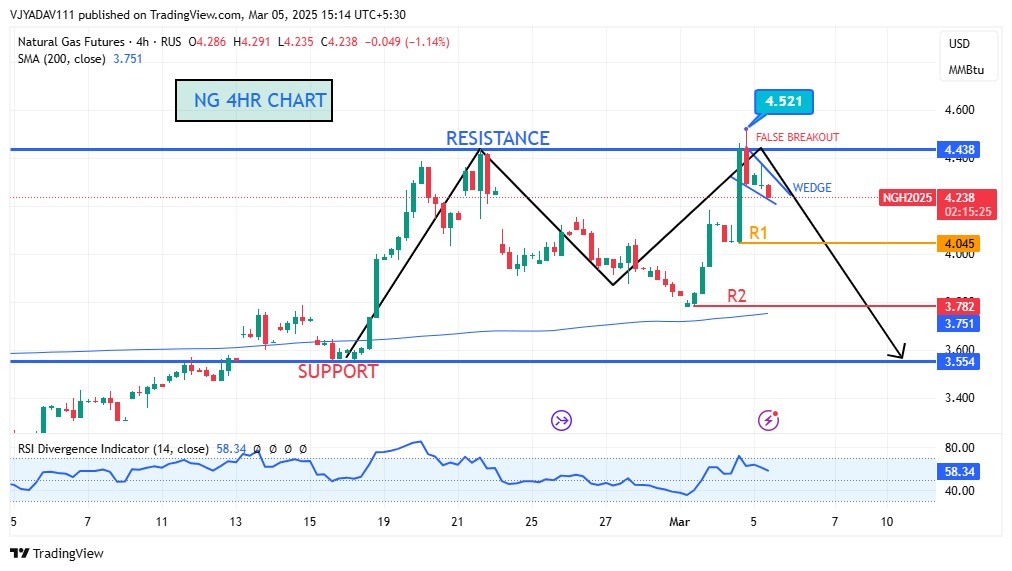
Natural Gas 4HR Chart False Breakout at...
March 05, 2025
Market Insights

NASDAQ gave resistance breakout and afte...
May 12, 2025
Market Insights
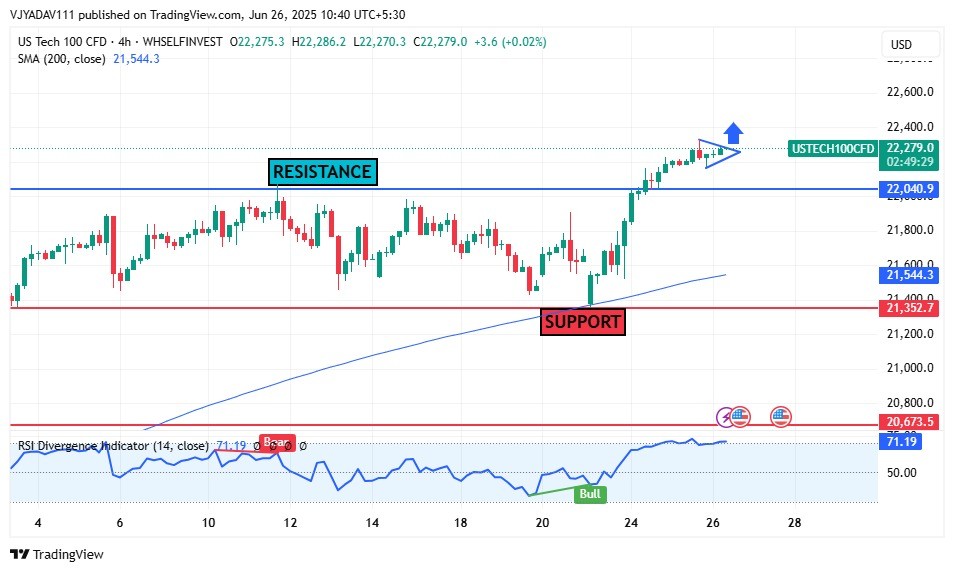
US Tech 100 Pushes Higher Key Support Ho...
June 26, 2025
Market Insights
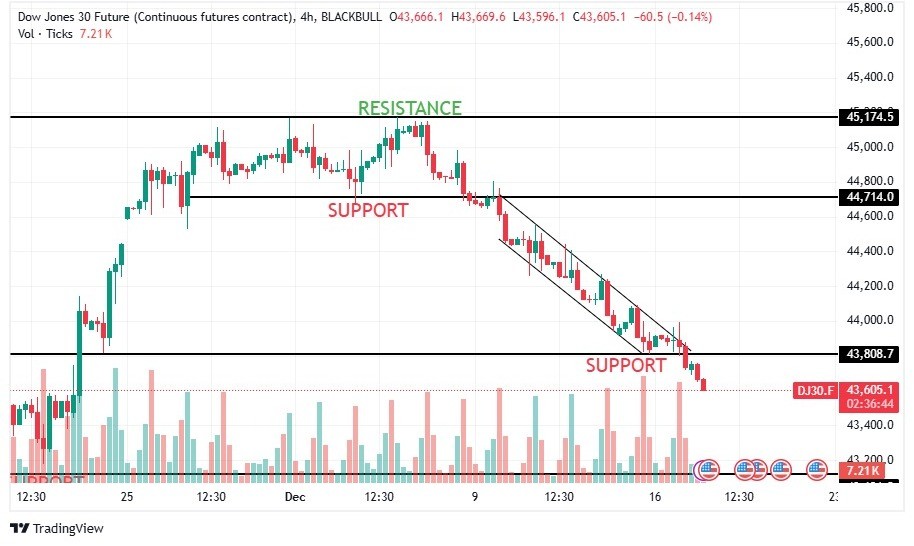
Dow Jones Industrial Average struggles t...
December 17, 2024
Live Charts


