Gold swiftly bounces back from 55-SMA on the Daily chart : Sign of a trend reversal or a temporary recovery?
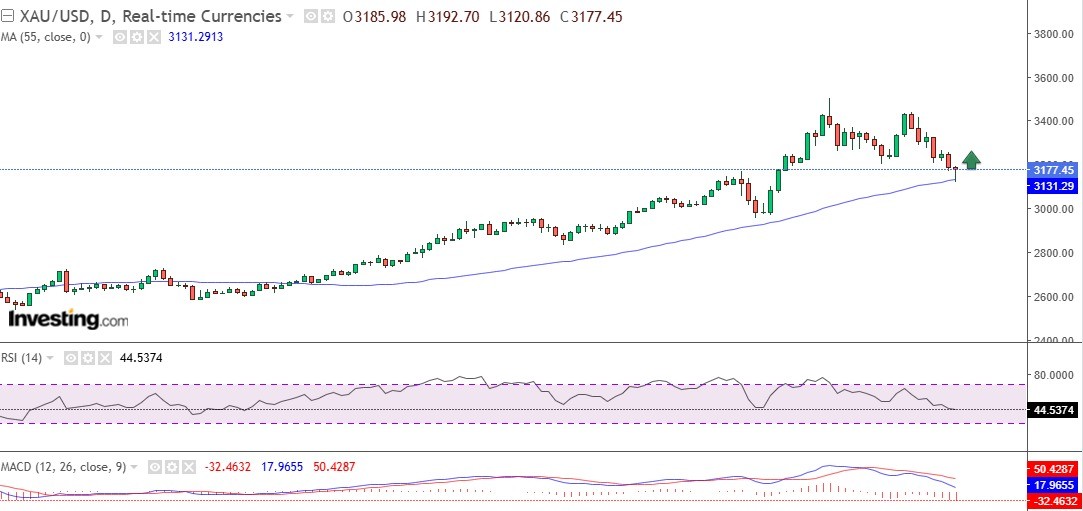
Bouncing back from the 55-Simple Moving Average on the Daily timeframe, Gold exhibits modest recovery after hitting the intraday low of $3120. The yellow metal travelled up by almost 60 points and recouped its early losses registered in the Thursday's Asian session. Adding to this, the dollar index failed to stabilize above the 101 mark and declined by 0.2% as the greenback lost its footing against its major peers, erasing gains from Monday when US-China announced a 90-days pause in their respective sweeping tariffs. The US 10 year treasury yields dropped from a monthly high to 4.51%, further acting as a tailwind for gold. The sharp recovery in gold prices and supportive fundamental factors raise odds of a trend reversal however from a technical perspective multiple resistance might cap the upside in the precious metal. Traders should wait for the release of Producer Price Index and the Fed chair Jerome Powell's appearance at a press conference today for fresh directional cues before placing any bet.
Recent News
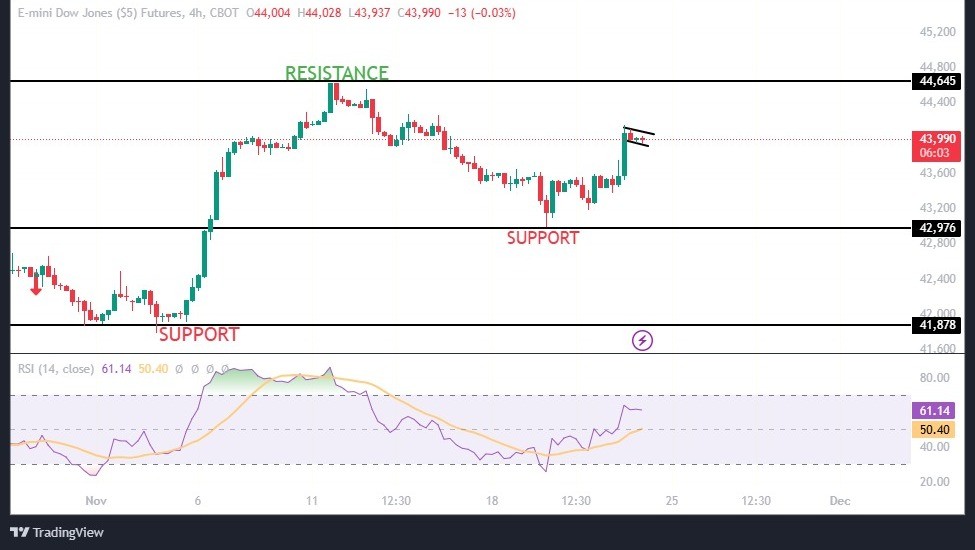
Dow Jones Industrial Average climbs on T...
November 22, 2024
Live Charts
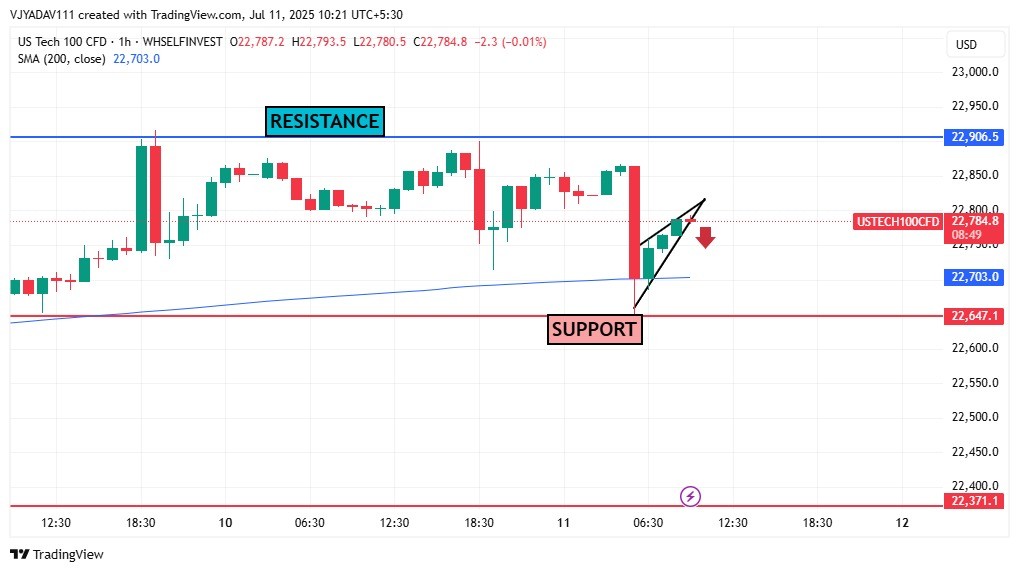
US Tech 100 Forms Bearish Flag – Breakdo...
July 11, 2025
Market Insights
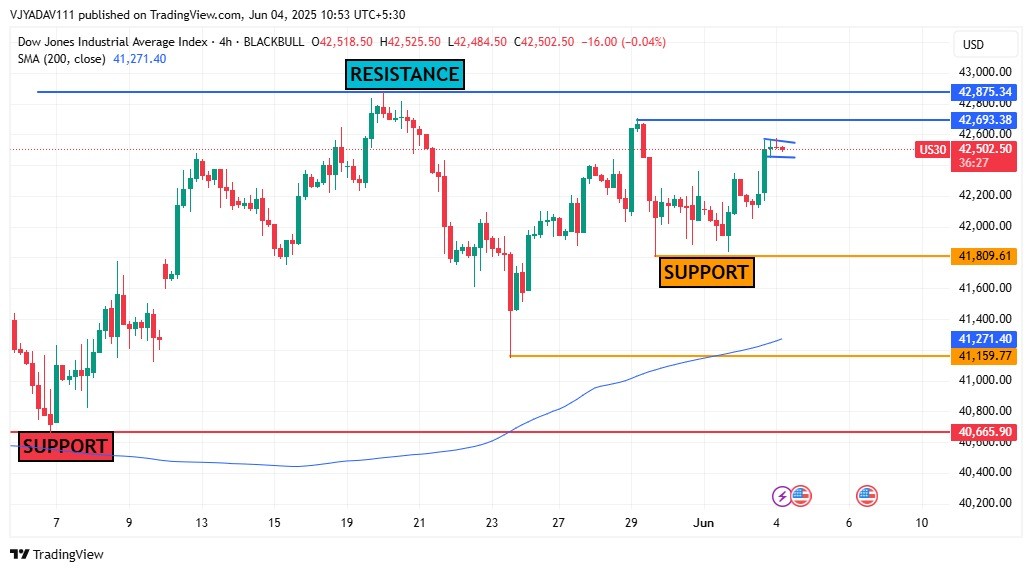
Dow Jones Testing Resistance Zone Key Le...
June 04, 2025
Market Insights
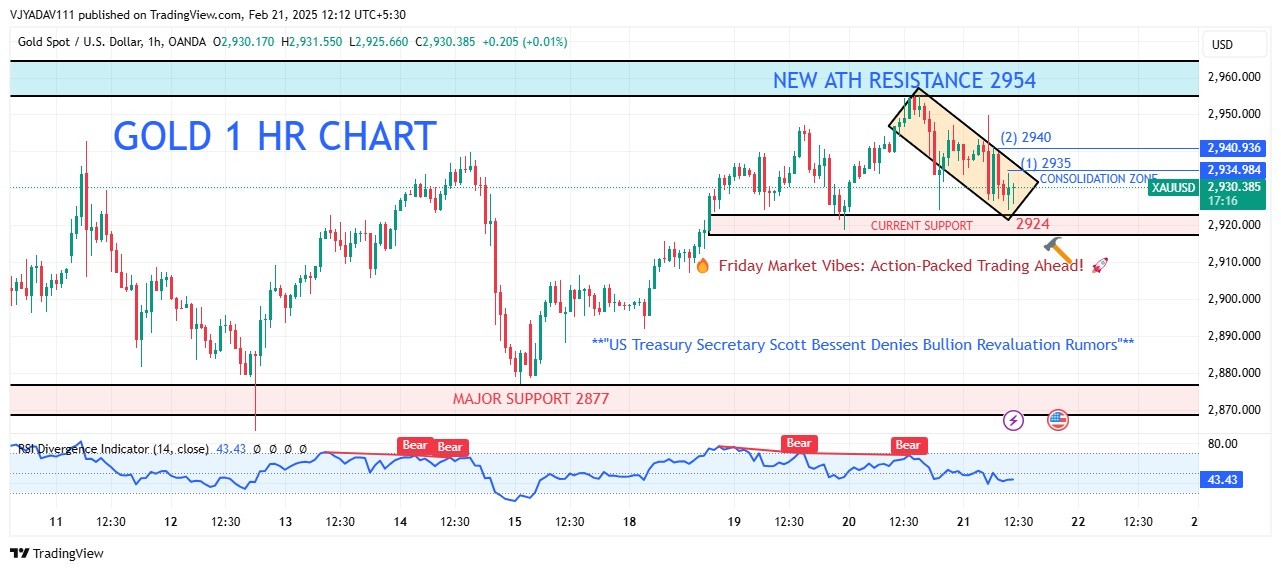
Gold Eyeing New Highs Amid Consolidation...
February 21, 2025
Market Insights
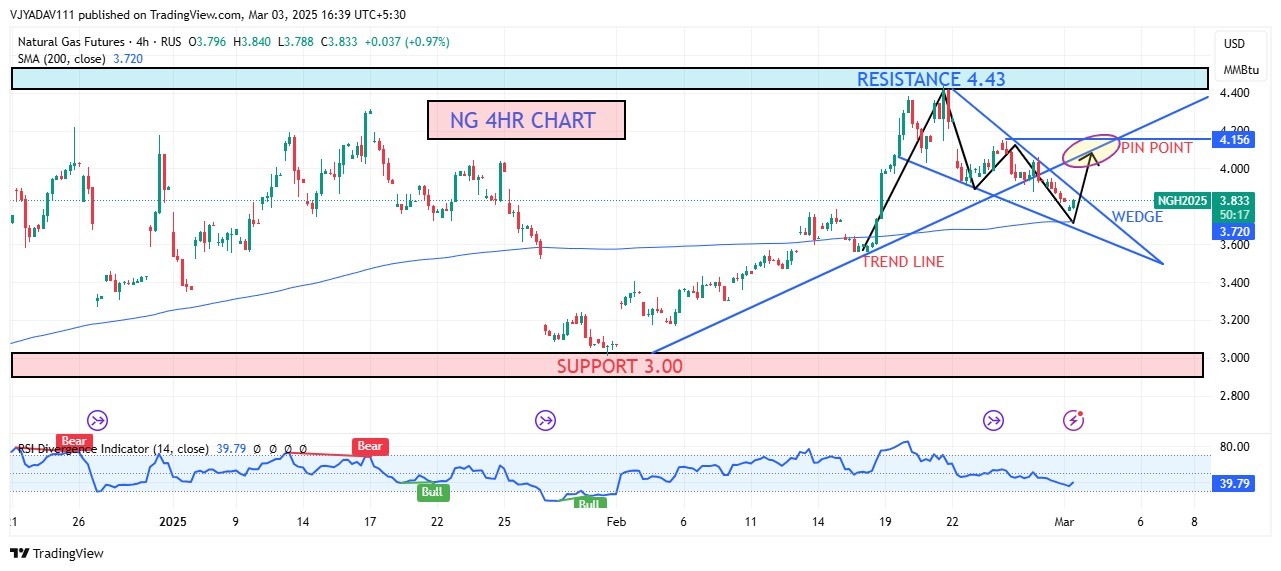
Natural Gas 4 Hour Chart Pinpointing the...
March 03, 2025
Market Insights
Dow Jones Industrial Average slips into...
December 16, 2024
Live Charts


