Gold remains under bearish pressure but finds support above $3,340 amid geopolitical uncertainty
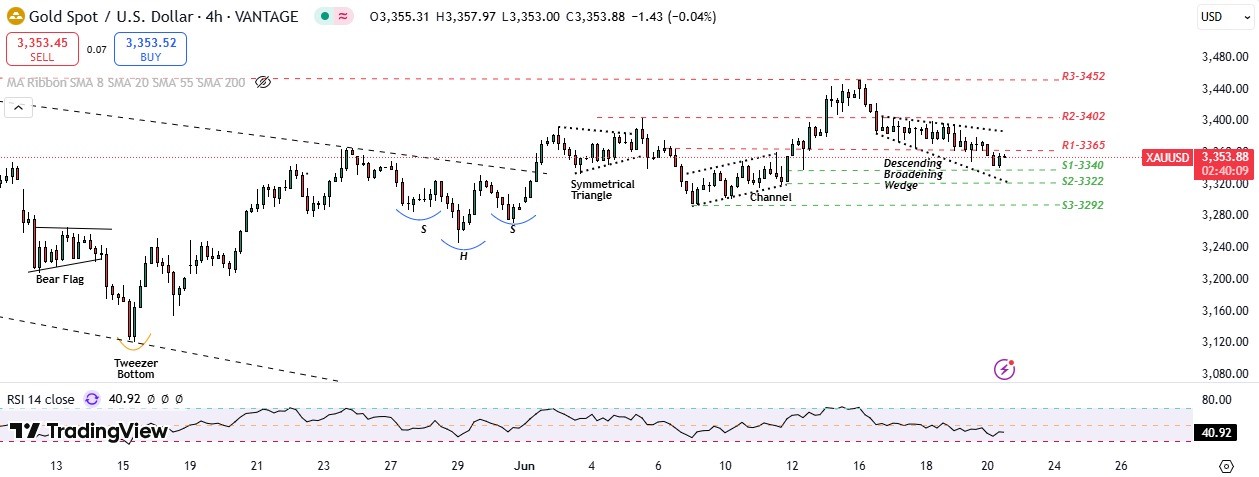
Gold (XAU/USD) is trading lower on Friday, as easing fears of a broader Middle East conflict have reduced demand for safe-haven assets. The metal has extended its decline from weekly highs near $3,450 and is heading for a 2.75% weekly loss — its steepest in six weeks.
Market tensions subsided after U.S. President Donald Trump signaled a two-week timeline to decide on possible military action against Iran, calming fears of an imminent escalation.
Additionally, reports of ongoing diplomatic talks between European officials and Iranian delegates have raised hopes for a peaceful resolution, sparking a risk-on rally that continues to weigh on gold prices.
XAU/USD TECHNICAL OVERVIEW
Technical Structure: Gold is exhibiting mixed signals across timeframes, reflecting short-term weakness within a broader consolidation phase. On the daily chart, a Doji candlestick pattern near the 20-day SMA suggests indecision, with prices holding just above this key moving average. The 4-hour chart shows a consolidation phase, indicating a lack of clear directional momentum in the medium term. However, the 1-hour timeframe reveals a bearish flag formation, hinting at potential downside continuation if support levels break.
Intraday Trend: The intraday bias remains bearish to neutral and favours the strategy of Selling on Support Breakdown and Selling on Resistance.
Weekly Trend: Neutral
Major Support: 3340, 3322, 3292
Major Resistance: 3365, 3385, 3402
Recent News
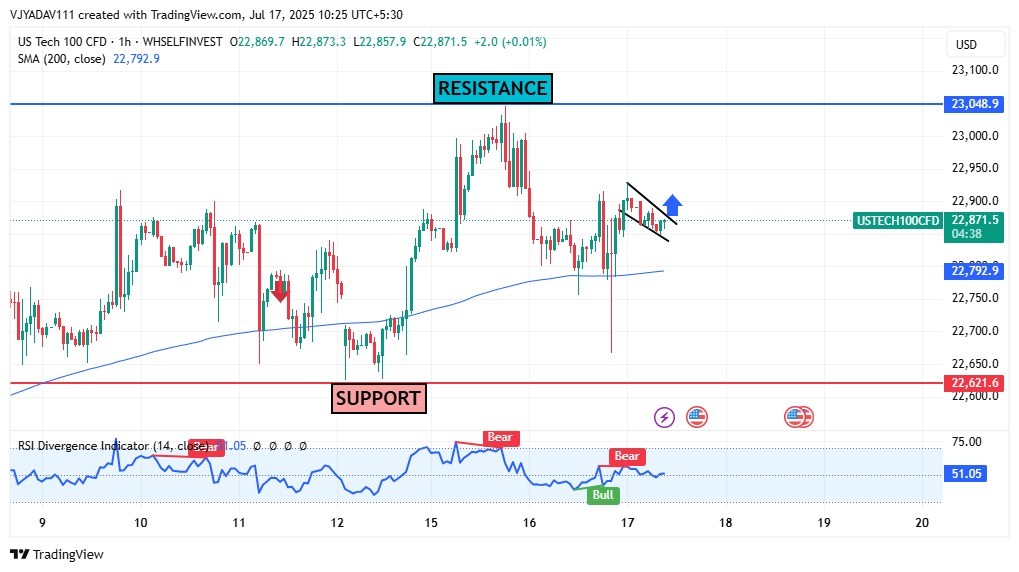
US Tech 100 Builds Bullish Flag Near 22,...
July 17, 2025
Market Insights
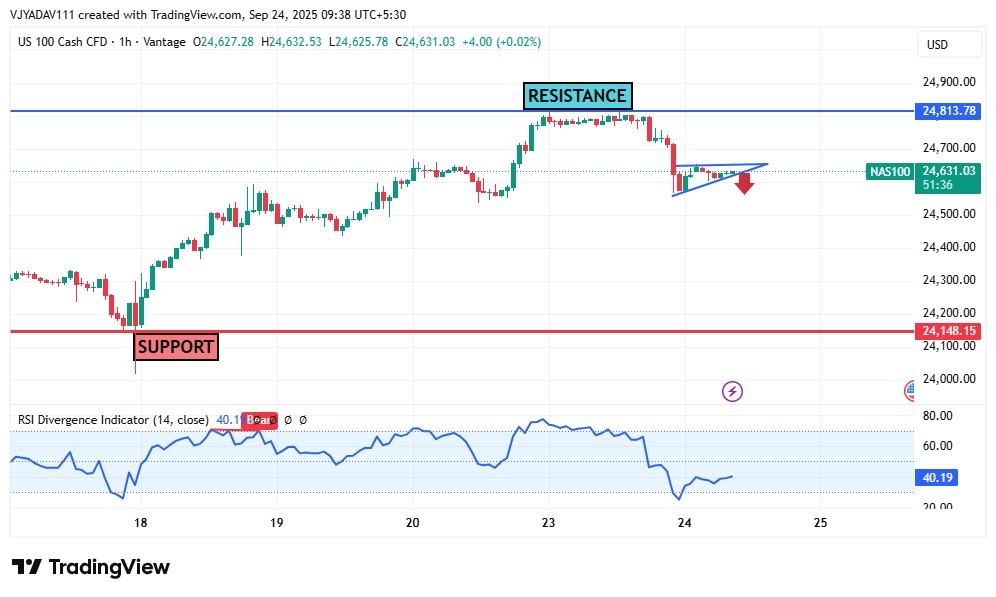
NAS100 Struggles Below 24,813 Resistance...
September 24, 2025
Market Insights
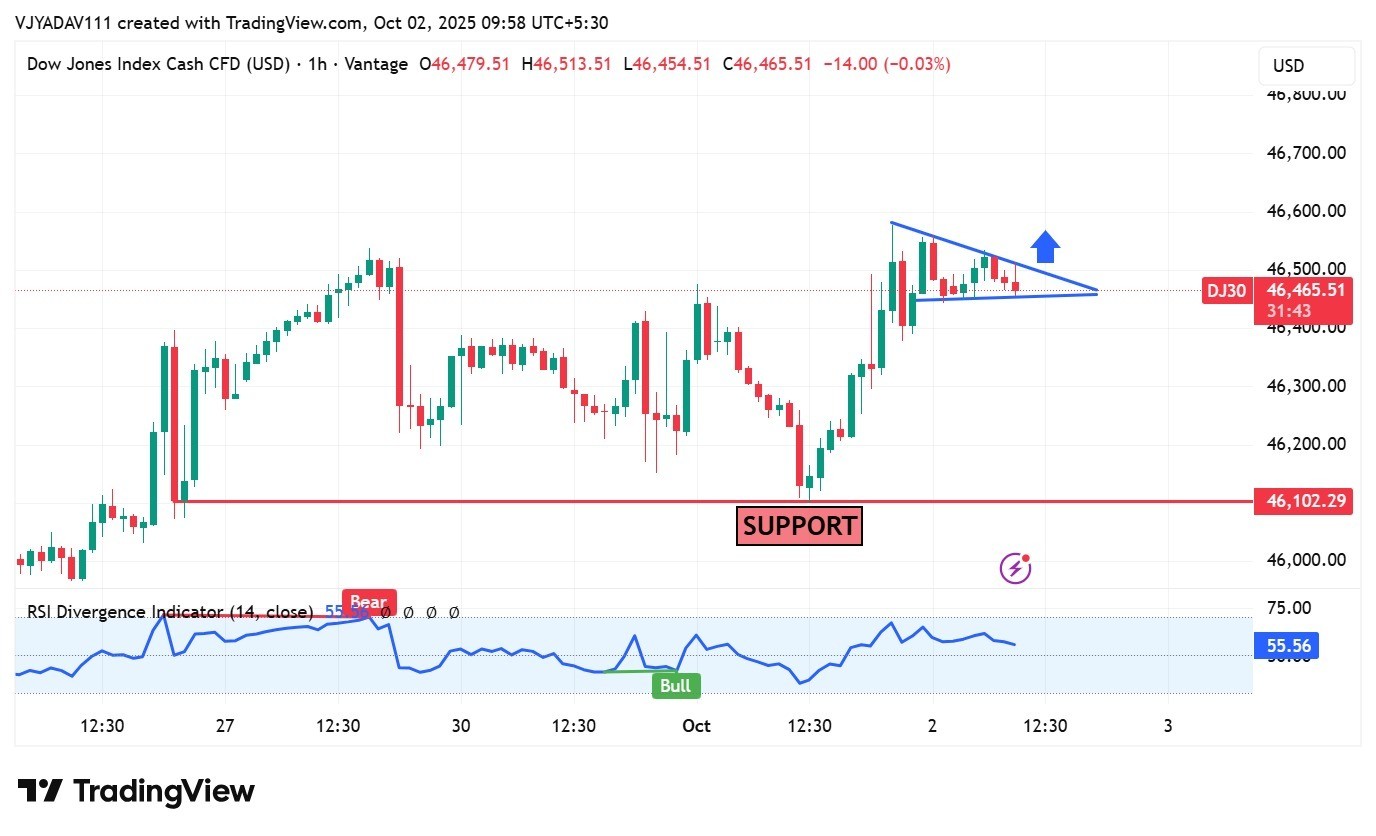
DOW JONES making a Wedge Pattern in 1hr...
October 02, 2025
Market Insights
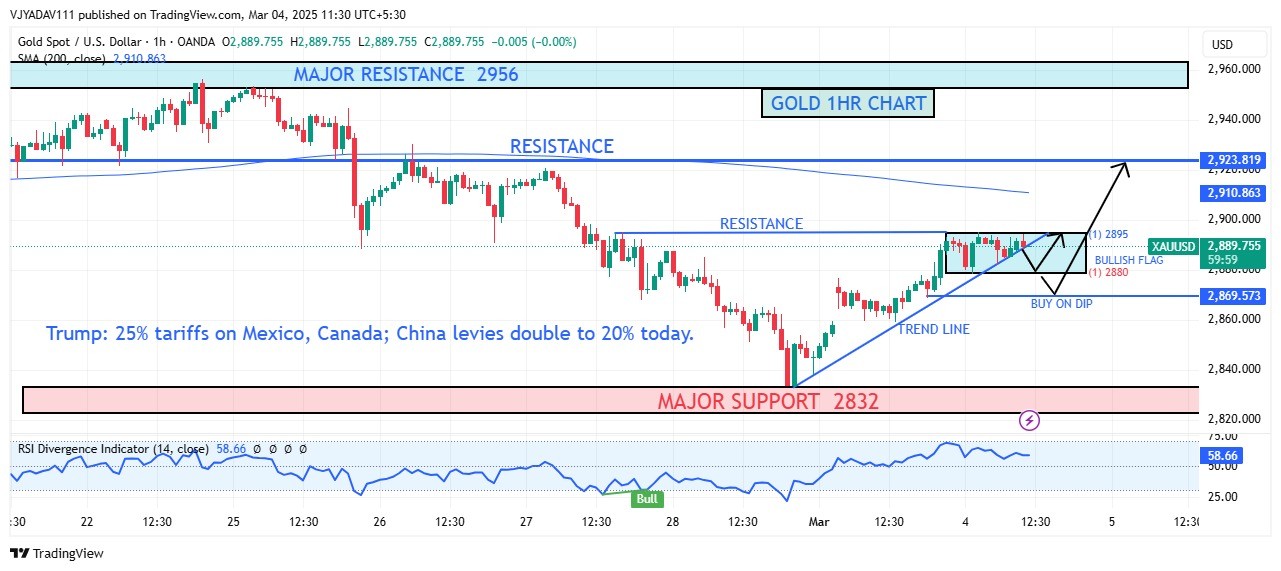
Gold Consolidates Near $2,890 Bullish Fl...
March 04, 2025
Market Insights
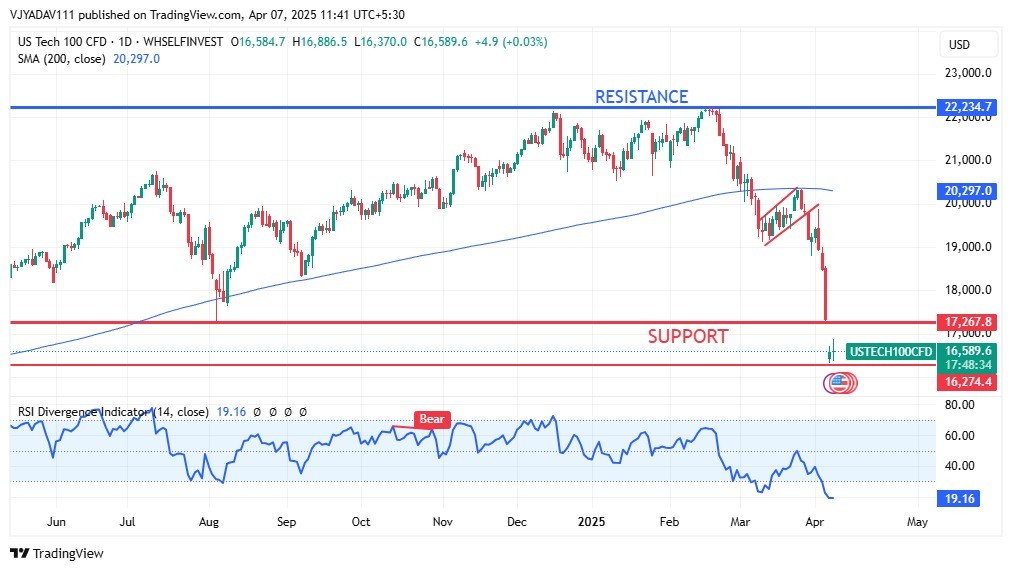
Nasdaq 100 Plunges to Critical Support a...
April 07, 2025
Market Insights
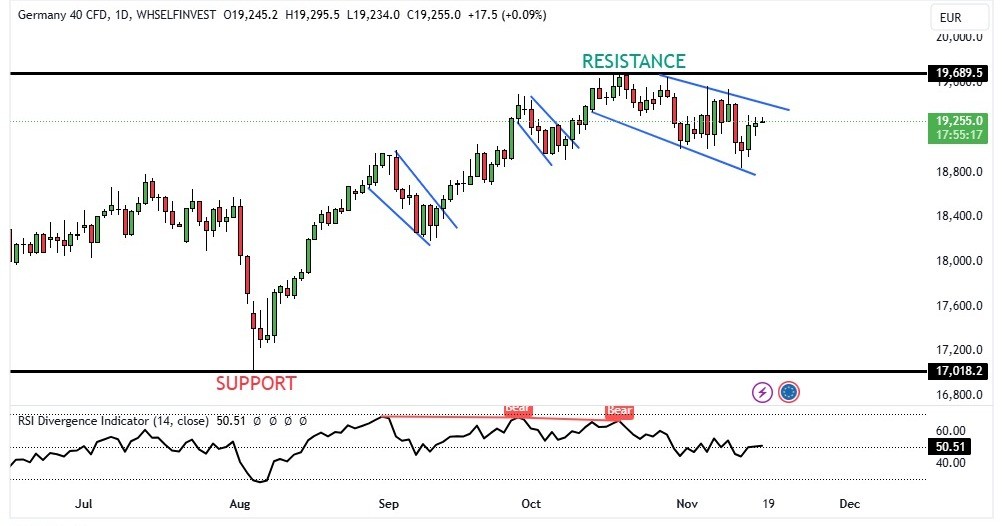
DAX sustaining on daily higher levels.
November 18, 2024
Market Insights


