Gold Prices Face Bearish Reversal as Head and Shoulders Pattern Forms Amid Weak U.S. Economic Data
Gold prices are at a critical juncture as a Head and Shoulders pattern emerges on the XAU/USD 1-hour chart. Despite support from central bank buying, rate cut expectations, and ETF inflows, the technical pattern signals a potential downside. Investors await Friday’s Nonfarm Payroll (NFP) report for further clarity on the Federal Reserve’s stance.
Technical Analysis: Key Levels to Watch
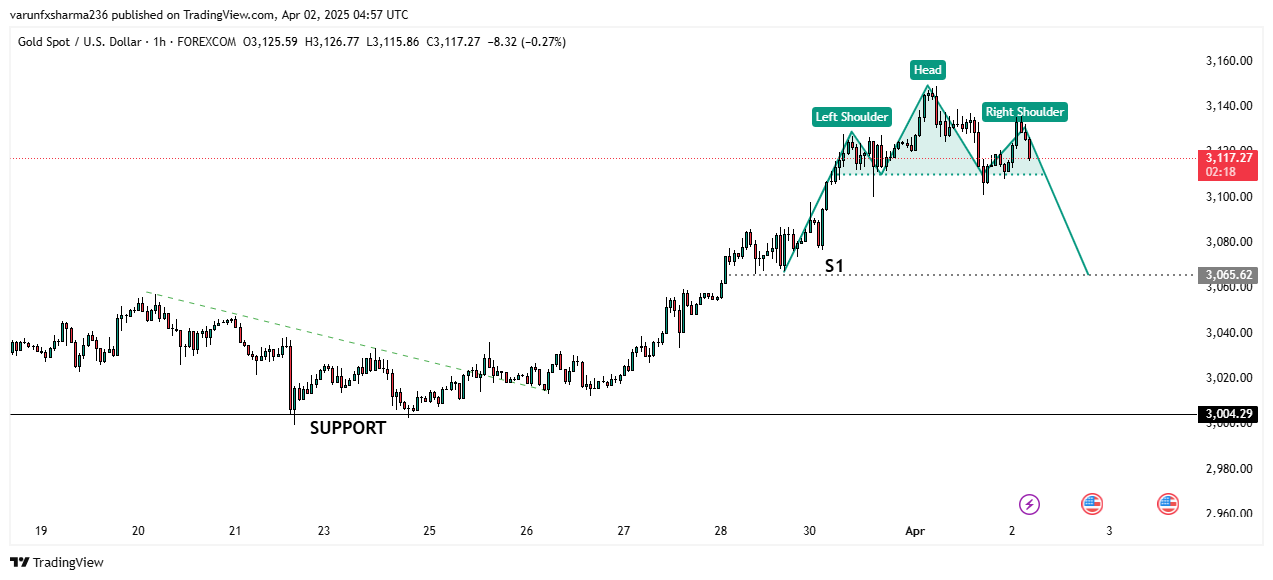
Gold recently formed a Head and Shoulders pattern, a bearish reversal signal:
Neckline (S1 at ~$3,100): A key support level; a break below confirms downside potential.
Support Levels: If the pattern plays out, gold may test $3,065, with a further decline to $3,004.
Resistance: A rebound above $3,115 could push prices to $3,140-$3,160.
Market Sentiment and Fundamentals
Bullish Factors: Rate cut expectations, Chinese ETF adding 233,000 ounces, and strong ETF demand.
Bearish Risks: Weak U.S. economic data and a potential strong NFP report boosting the dollar.
Outlook and Strategy
Gold remains in a critical decision zone:
Bearish case: A break below $3,100 could trigger a decline to $3,065 and $3,004.
Bullish case: Holding above $3,115 could lead to further gains.
NFP Report on Friday remains the key catalyst for the next major move
Recent News
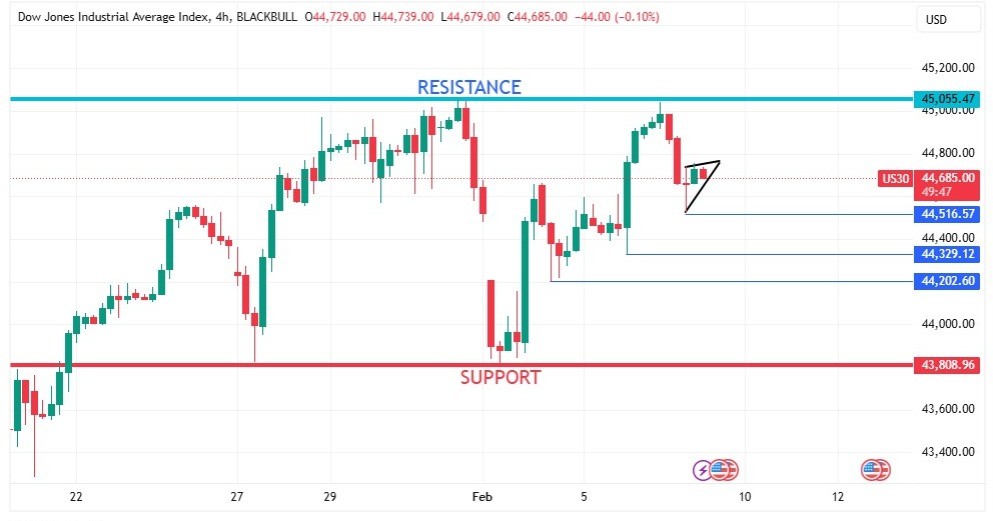
DOW JONES sustaining on daily lower leve...
February 07, 2025
Market Insights
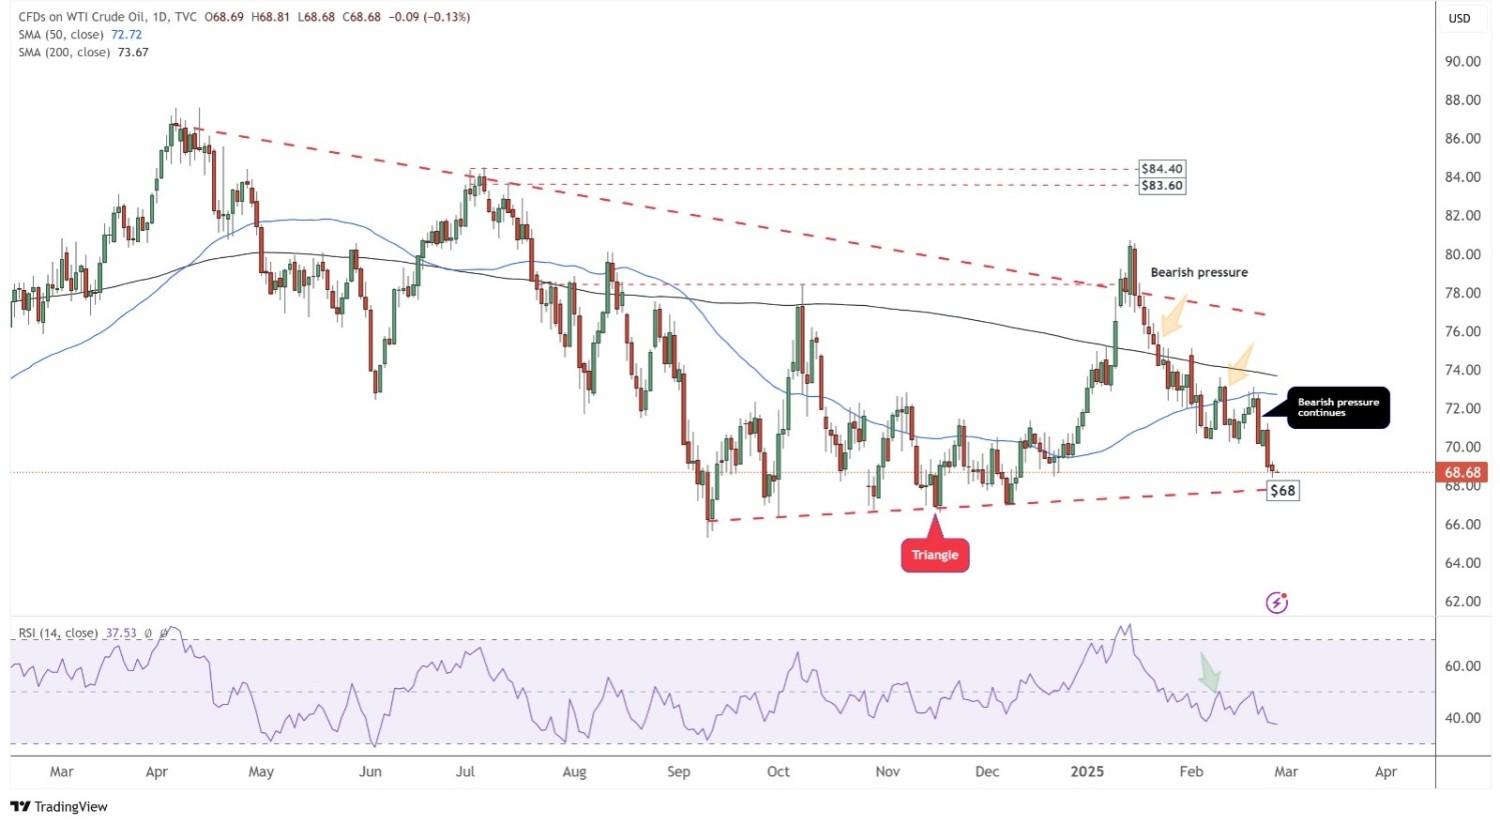
WTI Crude Oil Approaching Key $66–$68 Su...
February 27, 2025
Market Insights
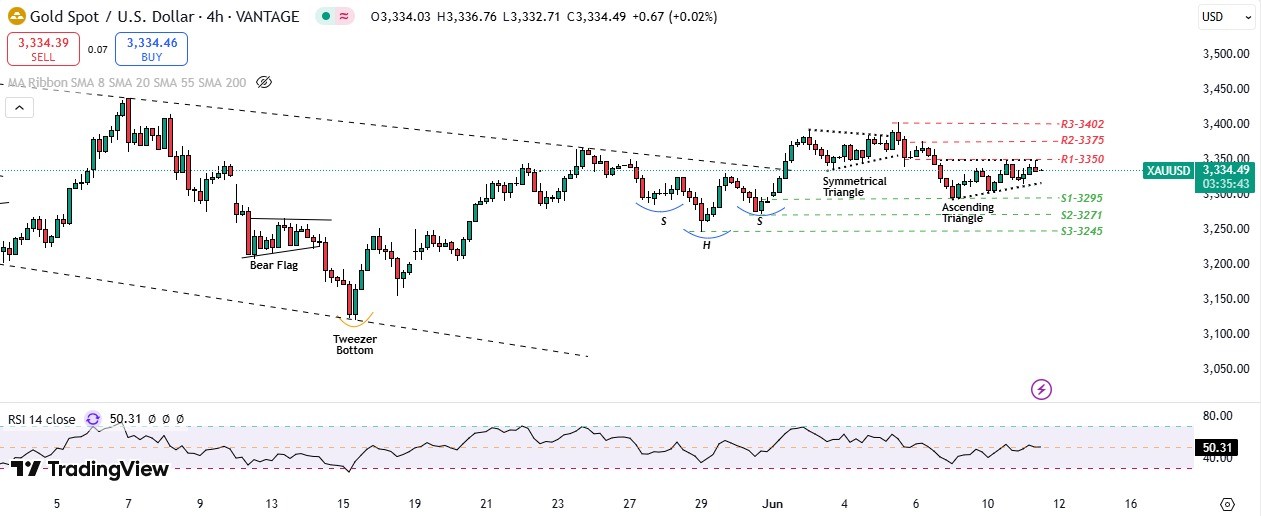
Gold stalls at $3,345 ahead of US CPI– W...
June 11, 2025
Market Insights
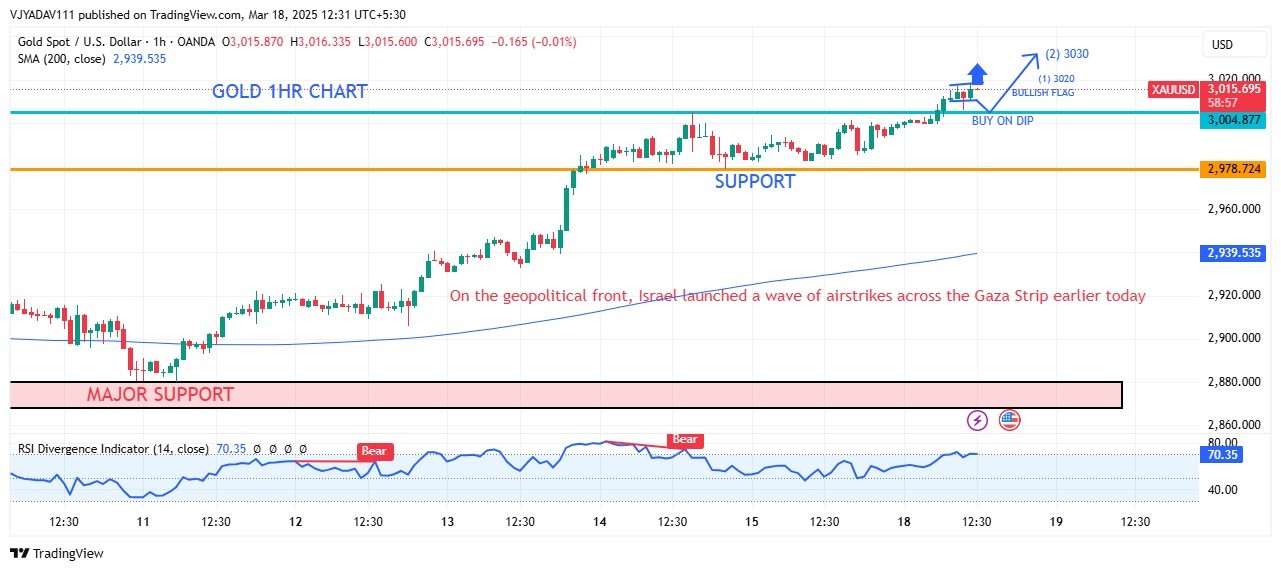
Bullish Flag Pattern Suggests Further Up...
March 18, 2025
Market Insights
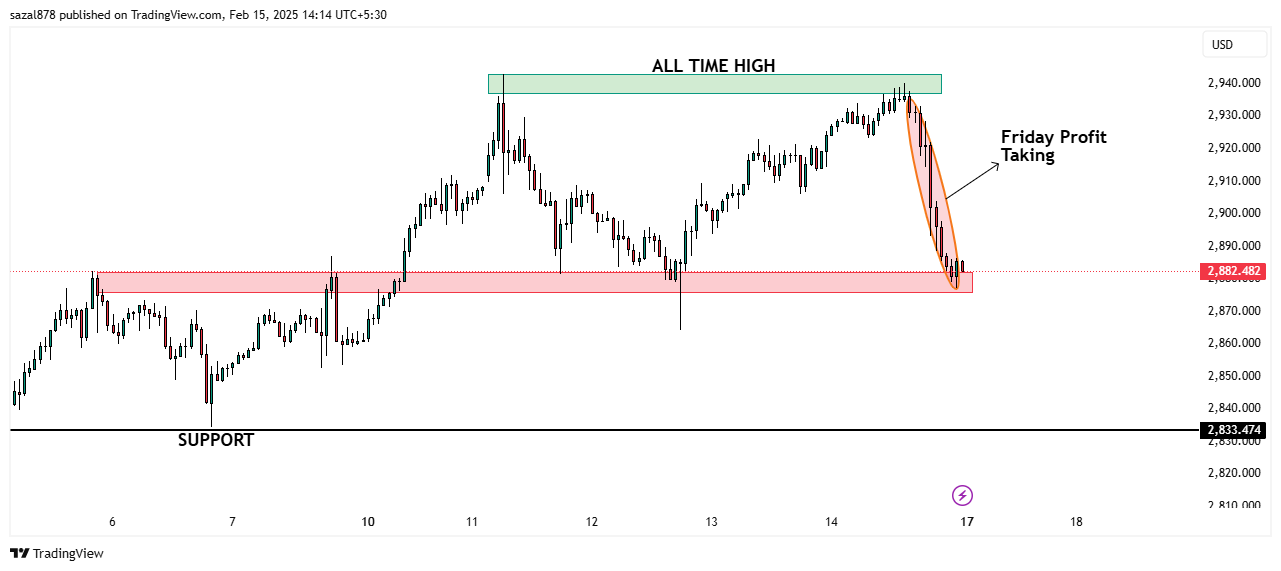
Market Analysis: Profit-Taking Leads to...
February 15, 2025
Market Insights
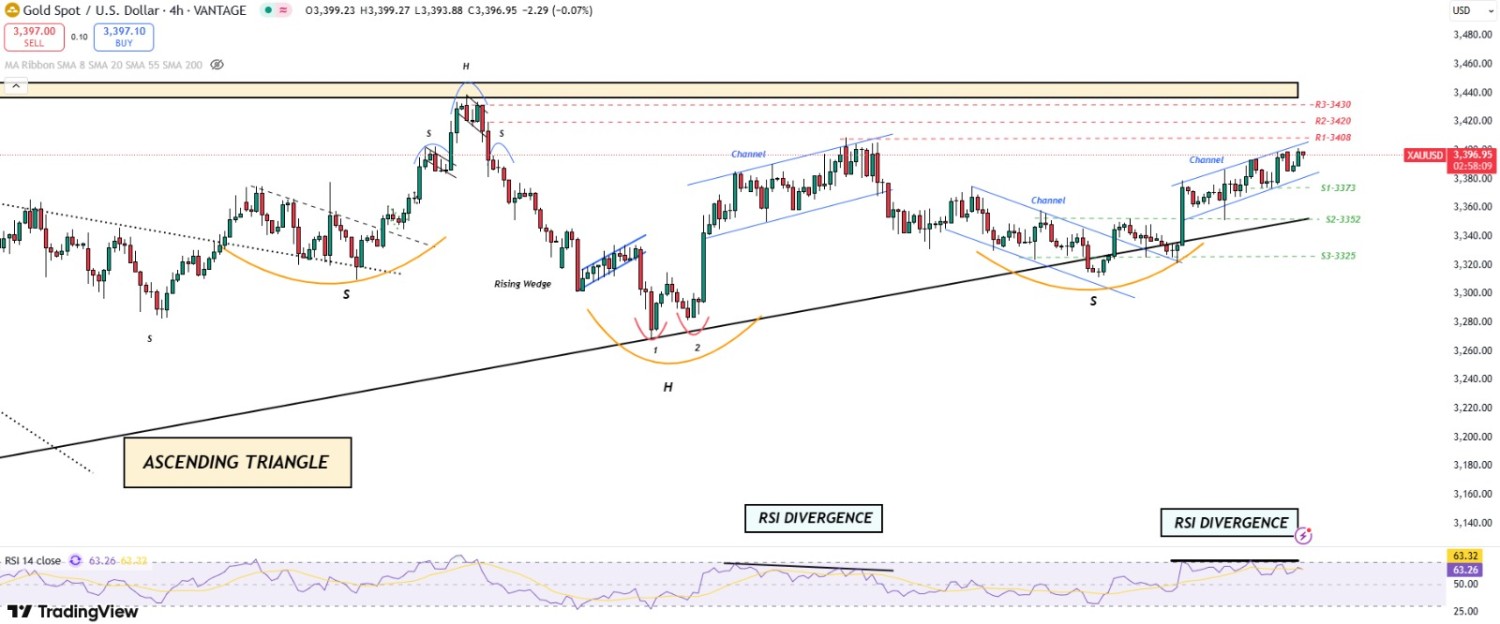
Gold at a crossroad: RSI Divergence is s...
August 28, 2025
Market Insights


