Gold Price Outlook: Bullish Reversal Signals Emerging as Key Resistance at $3,056 Comes into Focus
Technical Outlook
-
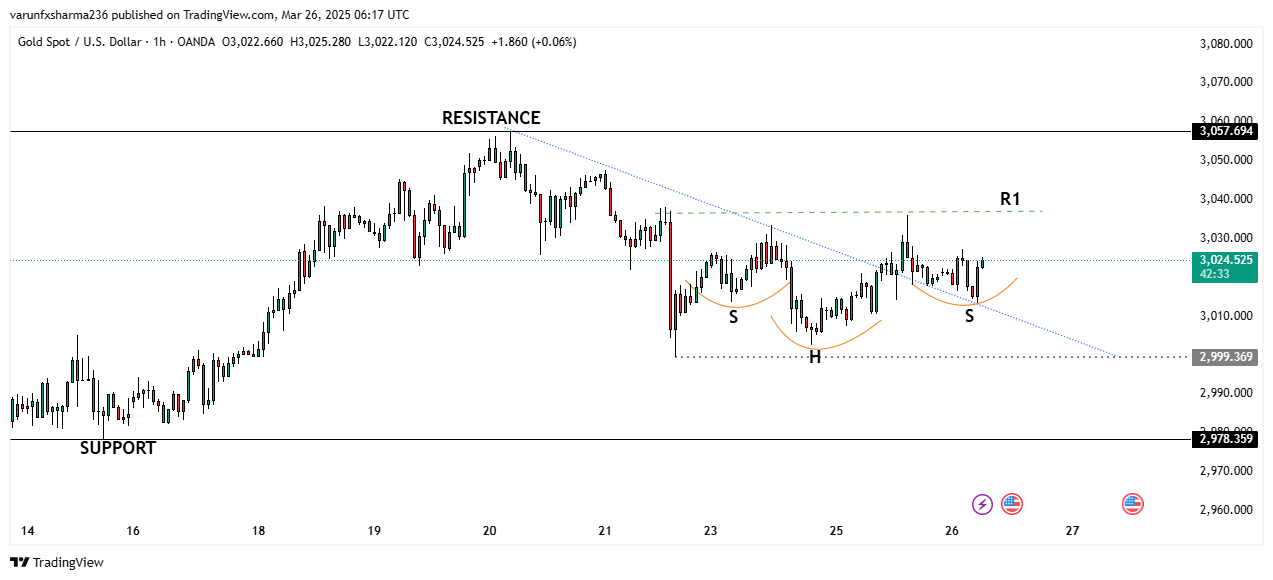
Inverse Head and Shoulders Pattern:
The chart indicates a potential bullish inverse head and shoulders formation, suggesting a possible breakout above the descending trendline. If the pattern plays out, gold could attempt to test higher resistance levels. -
Key Resistance Levels:
-
R1: Around $3,040, acting as a short-term resistance.
-
Major Resistance: $3,057, which aligns with last week’s peak. A breakout above this level could fuel further bullish momentum.
-
-
Key Support Levels:
-
$2,999 - $3,000: Critical psychological and technical support.
-
$2,978: A further downside target if selling pressure intensifies.
-
Recent News
Gold slips below $3,340 as strong US dat...
July 18, 2025
Market Insights
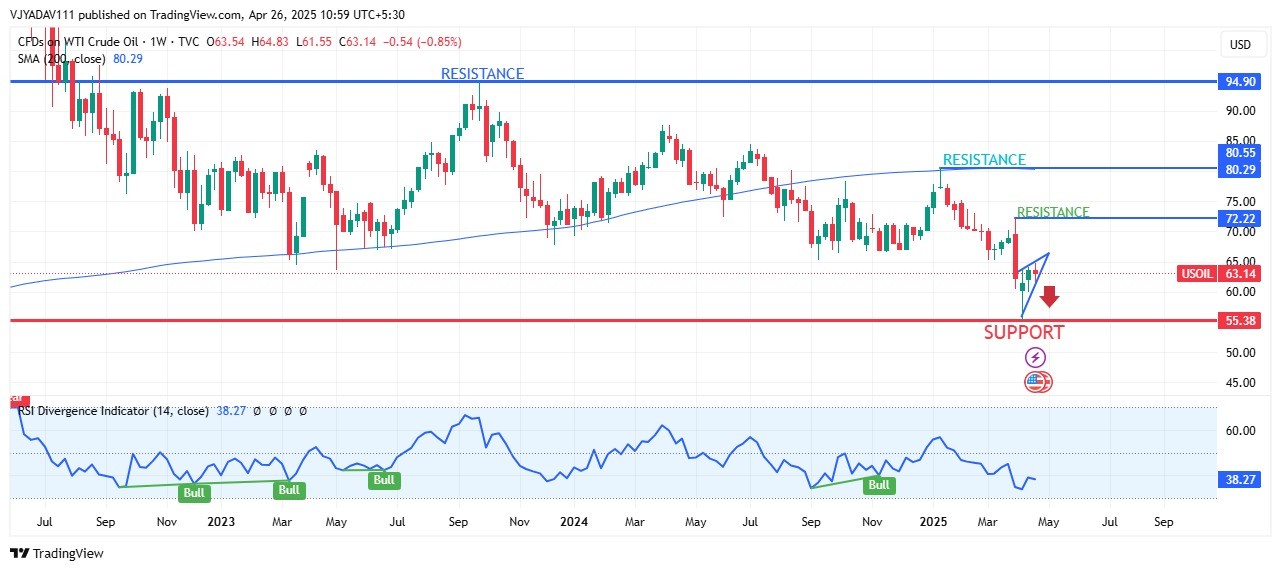
WTI CRUDE OIL AT CRITICAL LEVELS BEARISH...
April 26, 2025
Market Insights
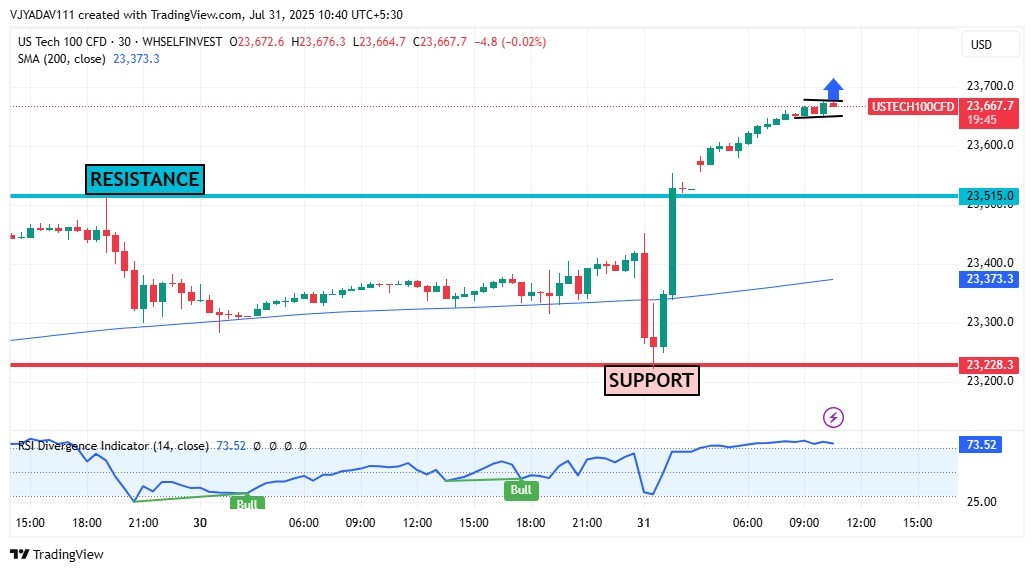
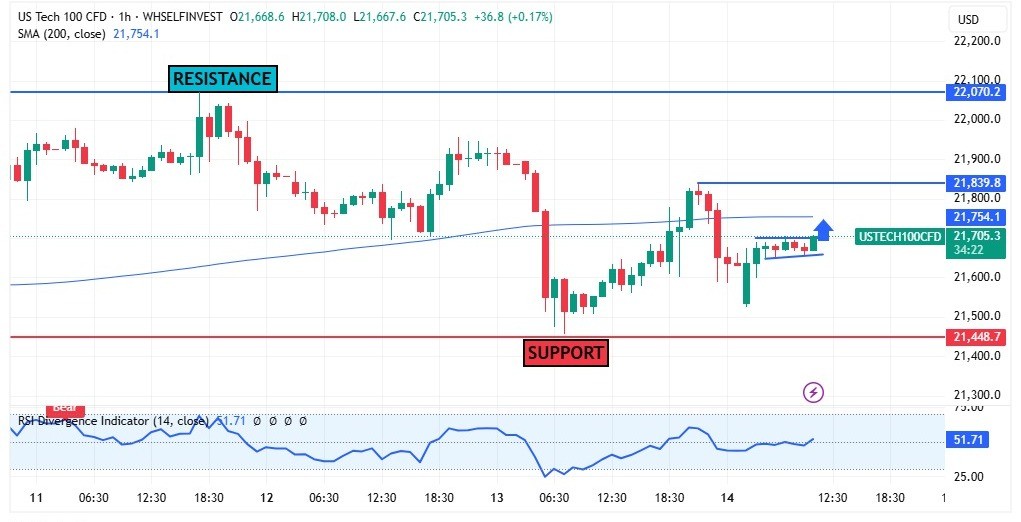
US100 Breaks Above Resistance Bullish Fl...
July 31, 2025
Market Insights
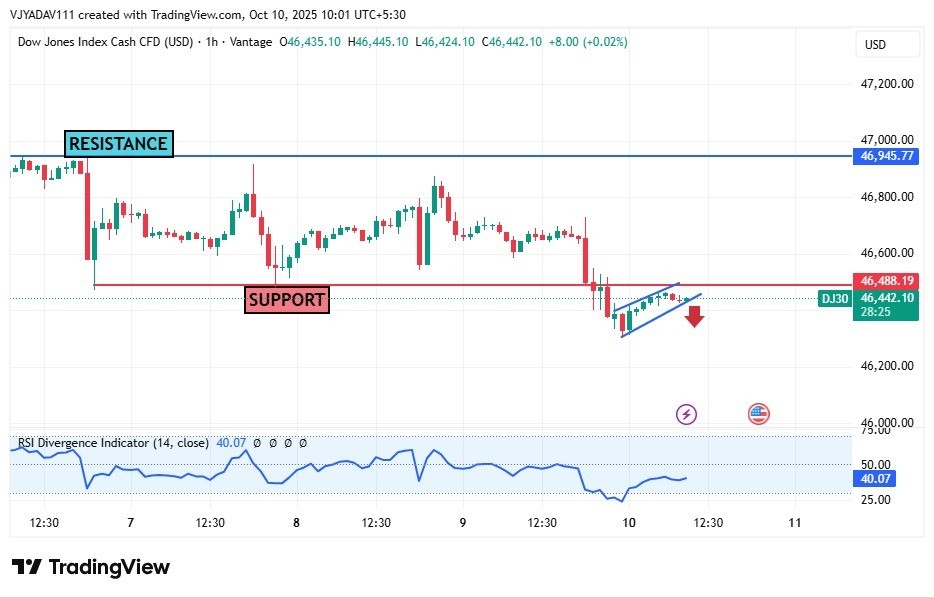
DOW JONES making a bearish flag in one h...
October 10, 2025
Market Insights
NASDAQ made a bullish flag will bull con...
June 16, 2025
Market Insights
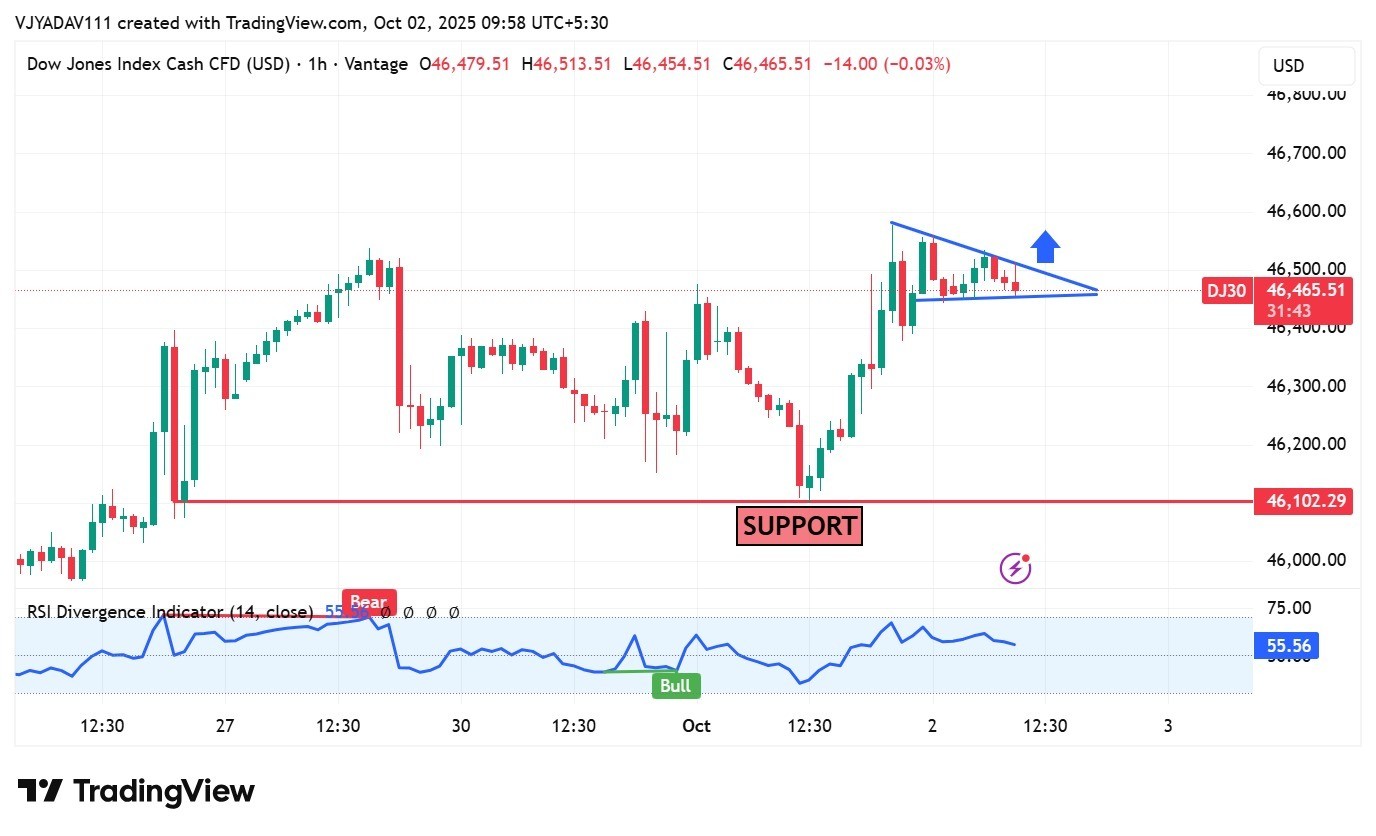
DOW JONES making a Wedge Pattern in 1hr...
October 02, 2025
Market Insights


