Gold price breaks records above $3200 on US-China trade clash
Gold price trades near record highs around $3220, supported by a weakening US Dollar and renewed US-China trade tensions. The metal’s safe-haven appeal remains strong as markets digest softer US inflation data and rising geopolitical risks.
US CPI data released Thursday showed inflation cooled more than expected in March, with the annual rate falling to 2.4% from 2.8% in February. Despite the softer data, inflation concerns linger after President Donald Trump doubled down on tariff threats against China, fueling market uncertainty.
On Wednesday, Trump announced a temporary reduction in tariffs for several countries. However, he sharply escalated tensions with China by raising tariffs to 125% effective immediately after Beijing retaliated with 84% duties on US imports. Renewed trade friction between the world’s two largest economies has heightened concerns over global growth, prompting investors to seek refuge in safe-haven assets like Gold, which remains well-supported.
XAU/USD TECHNICAL OVERVIEW
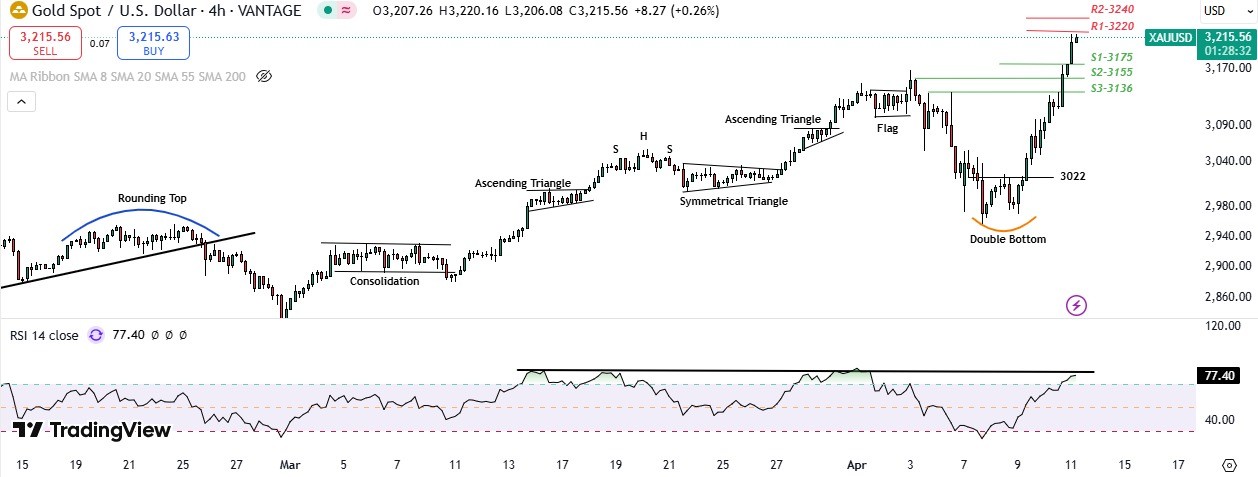
Gold prices remain in a firm uptrend, trading near all-time highs around $3220. The daily chart shows a Three White Soldiers pattern with price trading above the 20-day Simple Moving Average which confirms strong bullish momentum. Consolidation on the 4H chart and a bullish flag on the 1H chart suggest potential for further upside. Daily RSI hovers at 68, indicating strong momentum with limited signs of exhaustion. 4H RSI remains supportive around 60–65.
Intraday Trend/ Intraday Strategy: Bullish/ Buy on Breakouts, Buy on Support
Weekly Trend: Uptrend
Major Resistance: 3200, 3220, 3240
Major Support: 3175, 3155, 3136
- A sustained hold above 3200 would keep the bullish outlook intact, supported by safe-haven flows and ongoing trade tensions.
Recent News
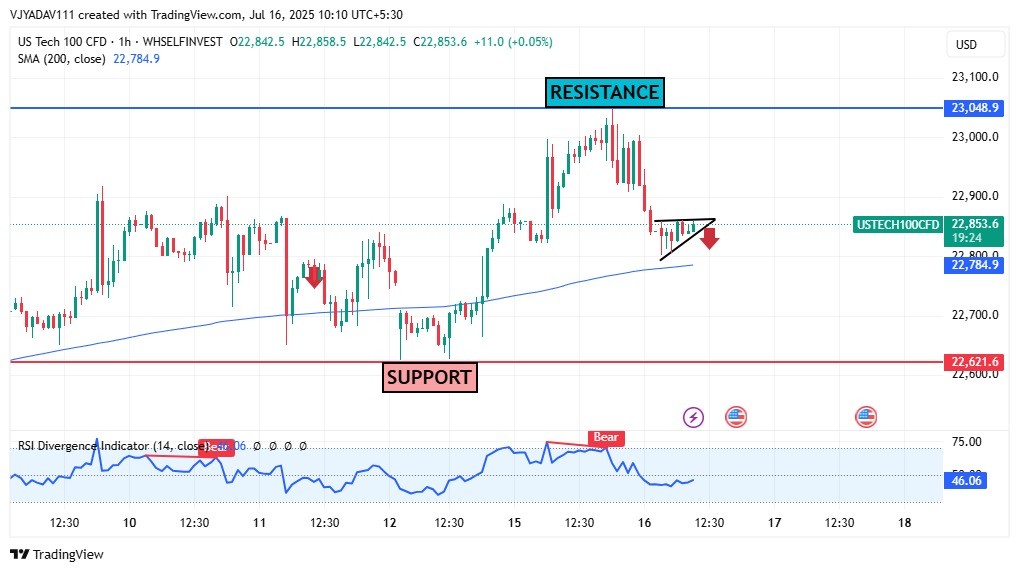
US Tech 100 Forms Bearish Triangle Patte...
July 16, 2025
Market Insights
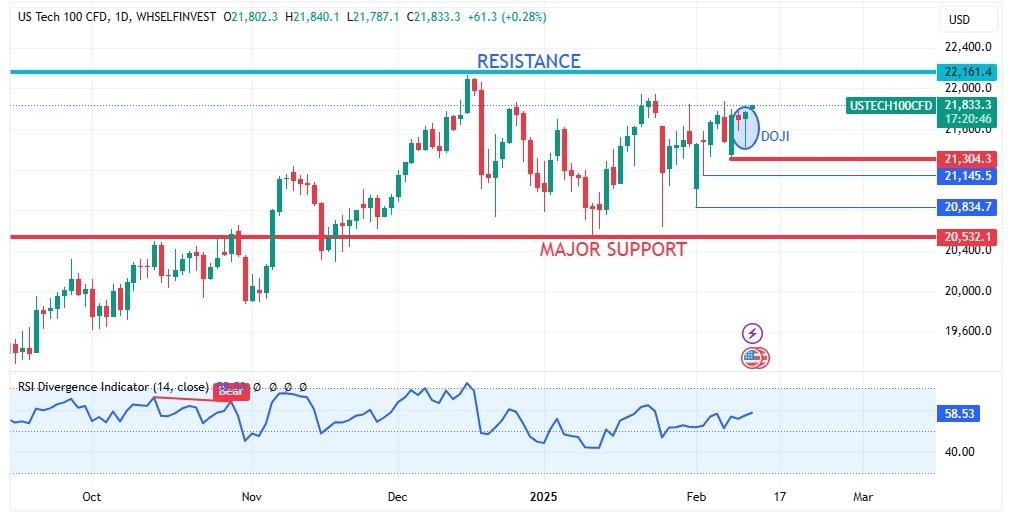
NASDAQ made a Doji on daily chart
February 13, 2025
Market Insights

Gold Price Lingers Near One-Month Low as...
November 12, 2024
Market Insights
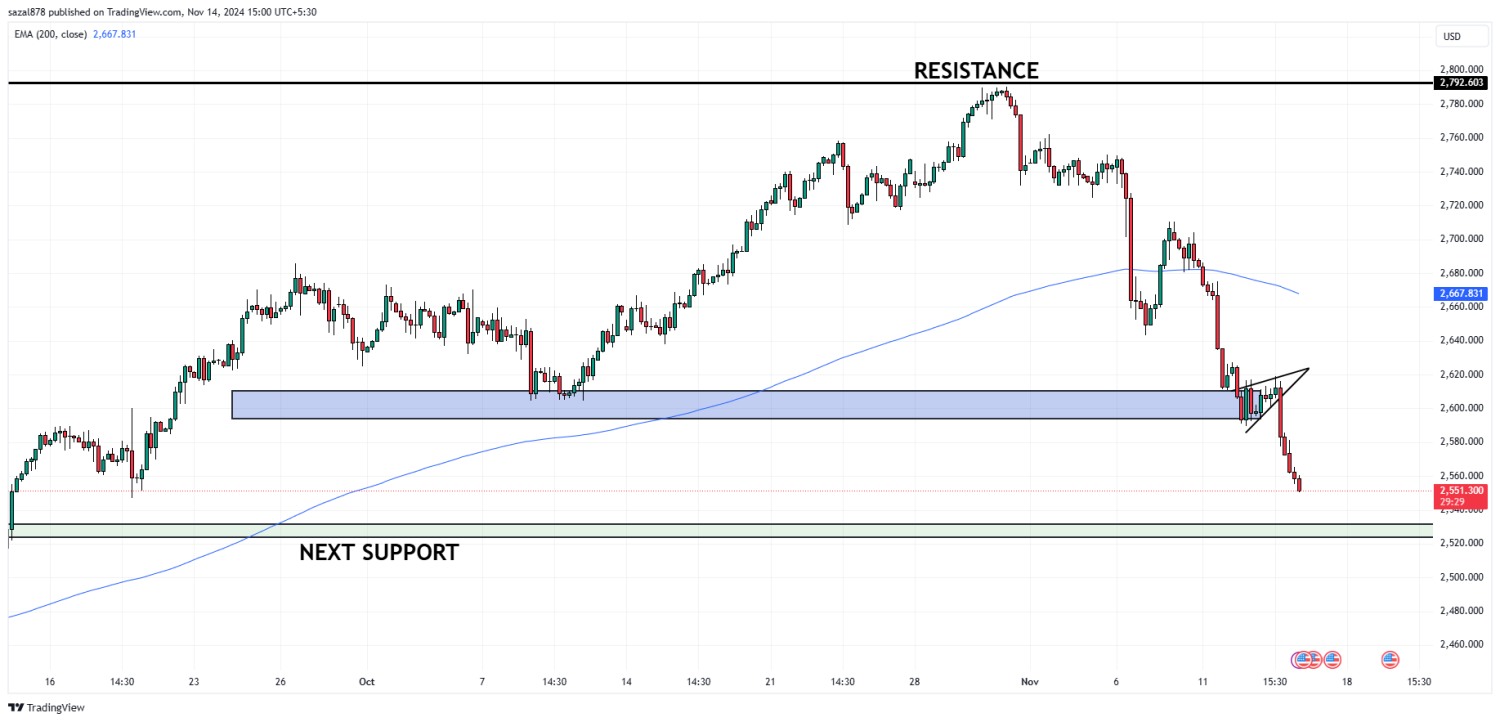
Gold’s Outlook Amid High Yields and a St...
November 14, 2024
Live Charts
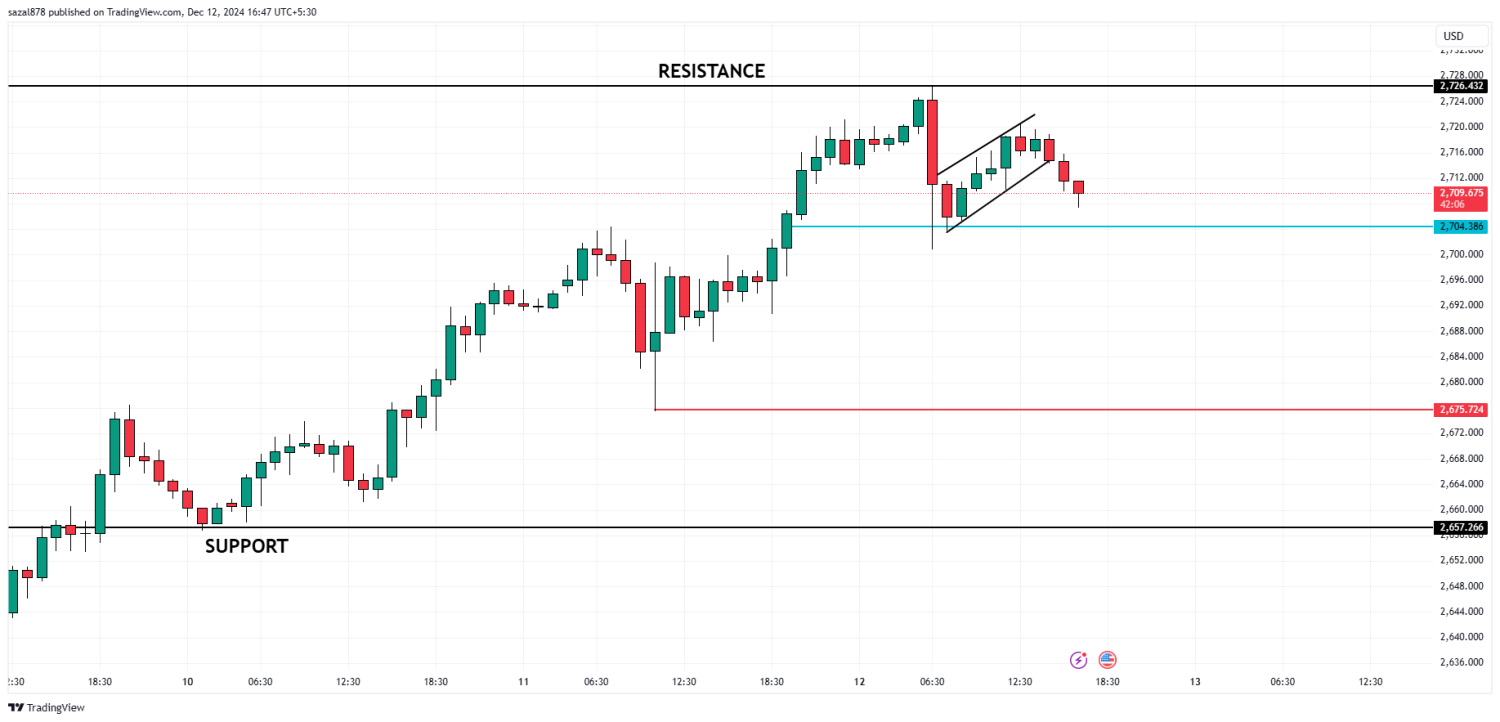
Gold Futures Retrace Slightly but Stay E...
December 12, 2024
Live Charts
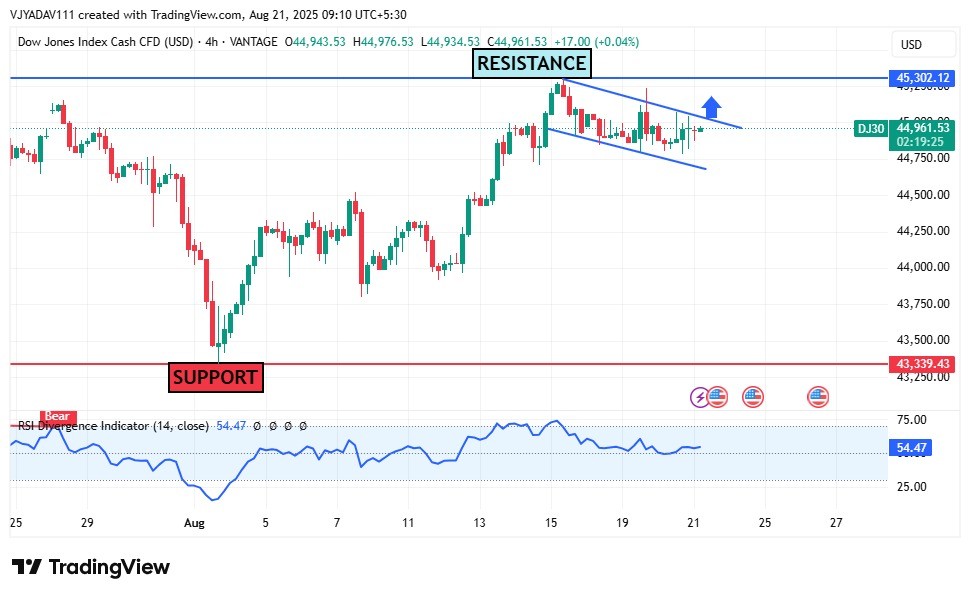
Dow Jones Eyes Breakout as Falling Wedge...
August 21, 2025
Market Insights


