Gold plunges to a one-month low, clings to 55-DSMA support
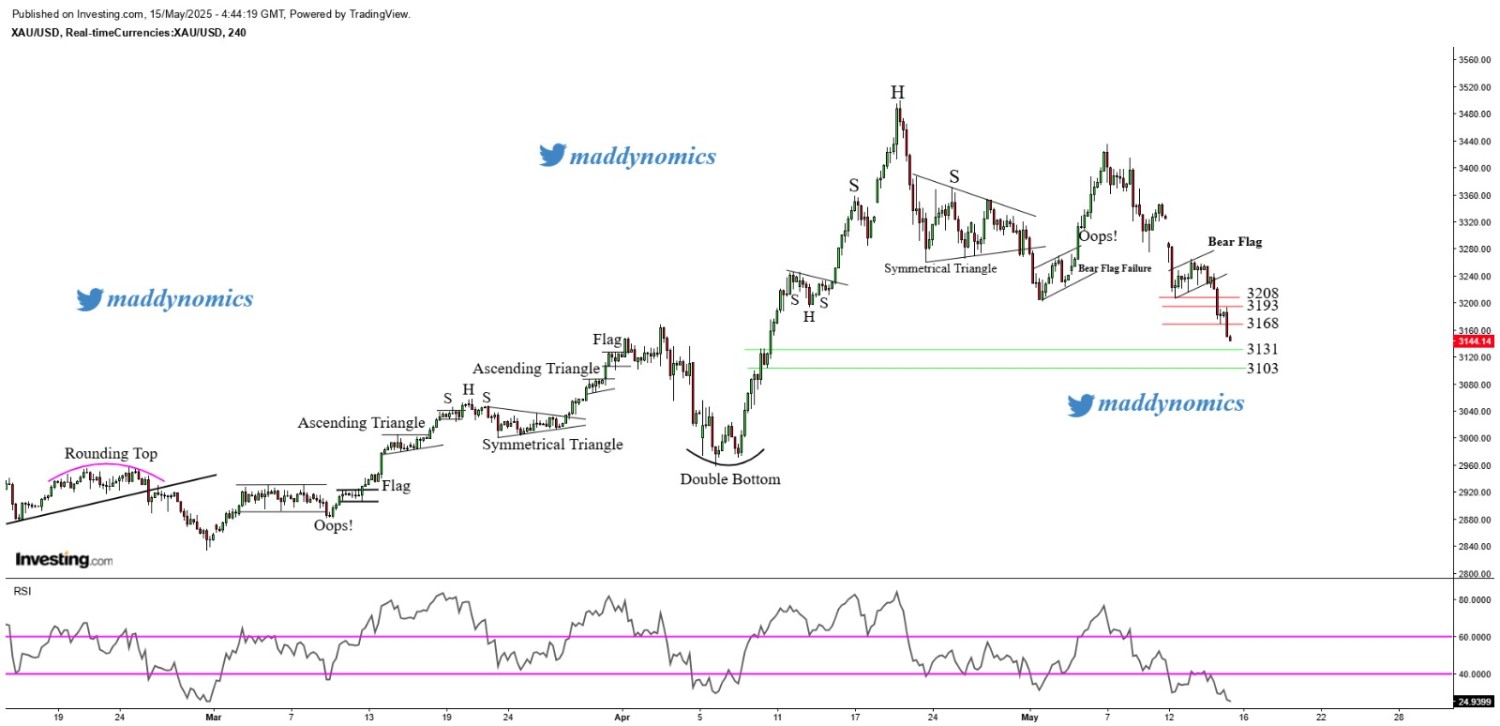
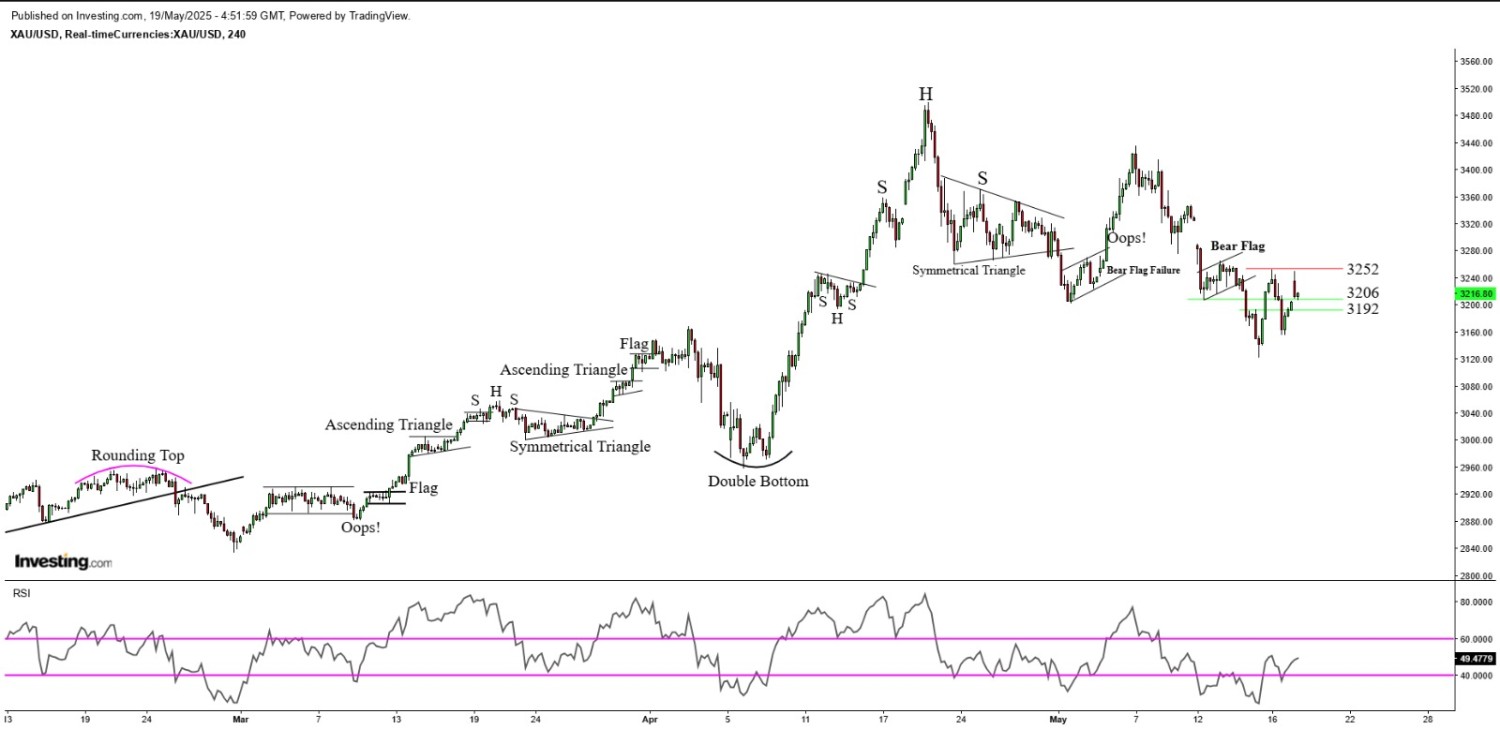
After hitting a record high of $3500 on April 22nd, Gold has shed as much as 10% and dropped to a one month low of $3130 with easing geopolitical tensions. Recent reconciliation between USA and China regarding the intense trade dispute continues to drive investors away from the safe-haven, hurting the yellow metal in the process. Furthermore, US 10 year treasury yields spiked to the highest level in one month due to Fed's contractionary monetary stance, exerting pressure on Gold prices. Traders will be closely monitoring the Producer Price Index report due for today and Fed chair Jerome Powell's commentary to gain insights into monetary policy and economic projections which might influence the price trajectory.
XAU/USD TECHNICAL OVERVIEW
Technical Structure: Gold extended decline for third session in a row which can be depicted by a Bearish Candle formed on the Daily chart. However, prices find support at 55-DSMA on the daily timeframe break of which would lead to further decline. 4-Hour chart displays Breakdown of a Bearish Flag, indicating that bearish biasness remains across multiple timeframes.
Intraday Trend/ Intraday Strategy: The intraday trend remains Bearish and favours the strategy of Selling on break of support and Selling on rise.
Weekly Trend: Bearish
Major Support: 3130, 3113, 3100
Major Resistance: 3156, 3165, 3175
Recent News
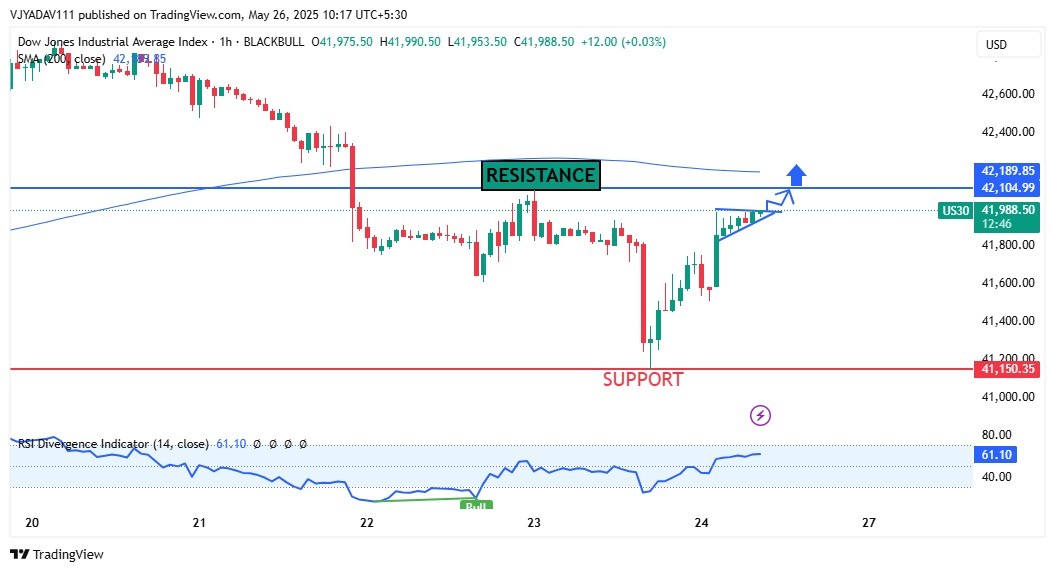
Dow Jones Industrial Average Testing Key...
May 26, 2025
Market Insights
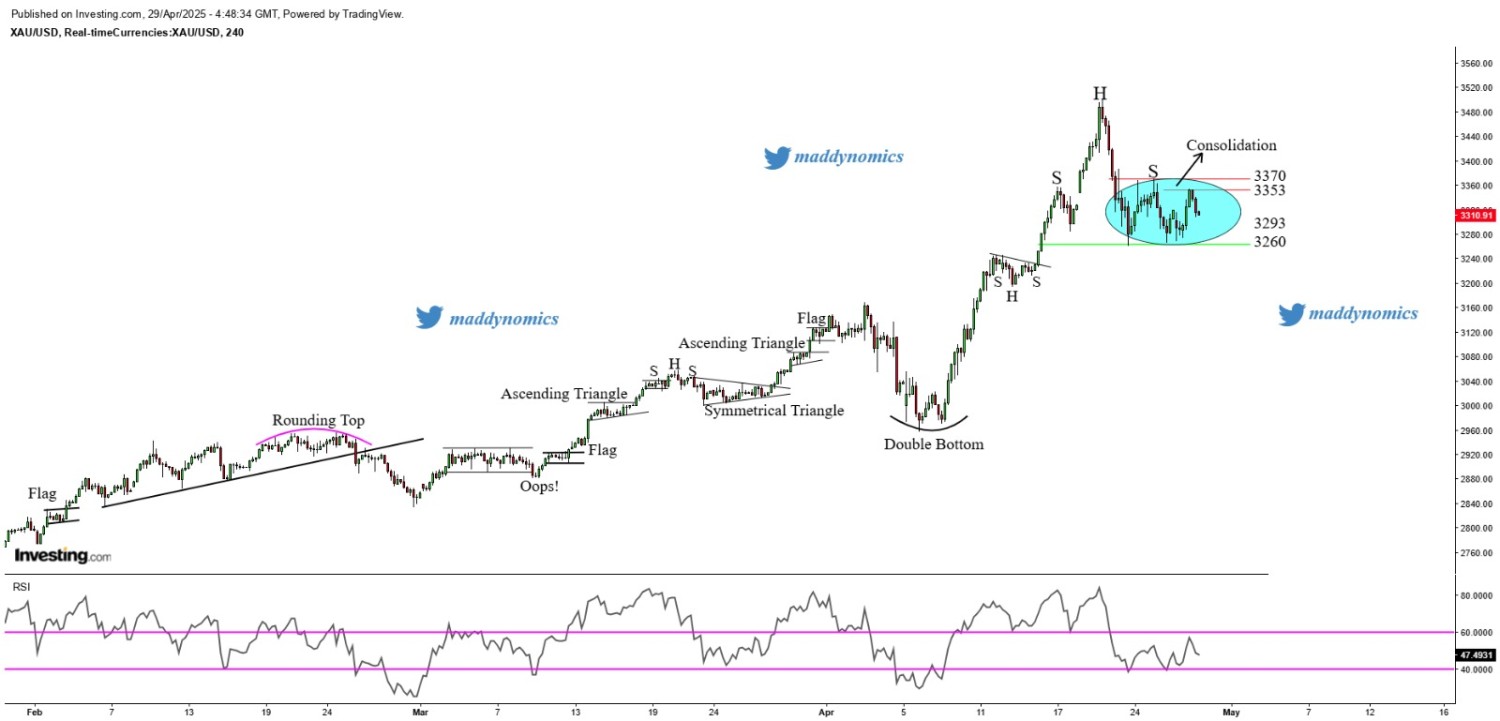
Gold consolidates but remains vulnerable...
April 29, 2025
Market Insights
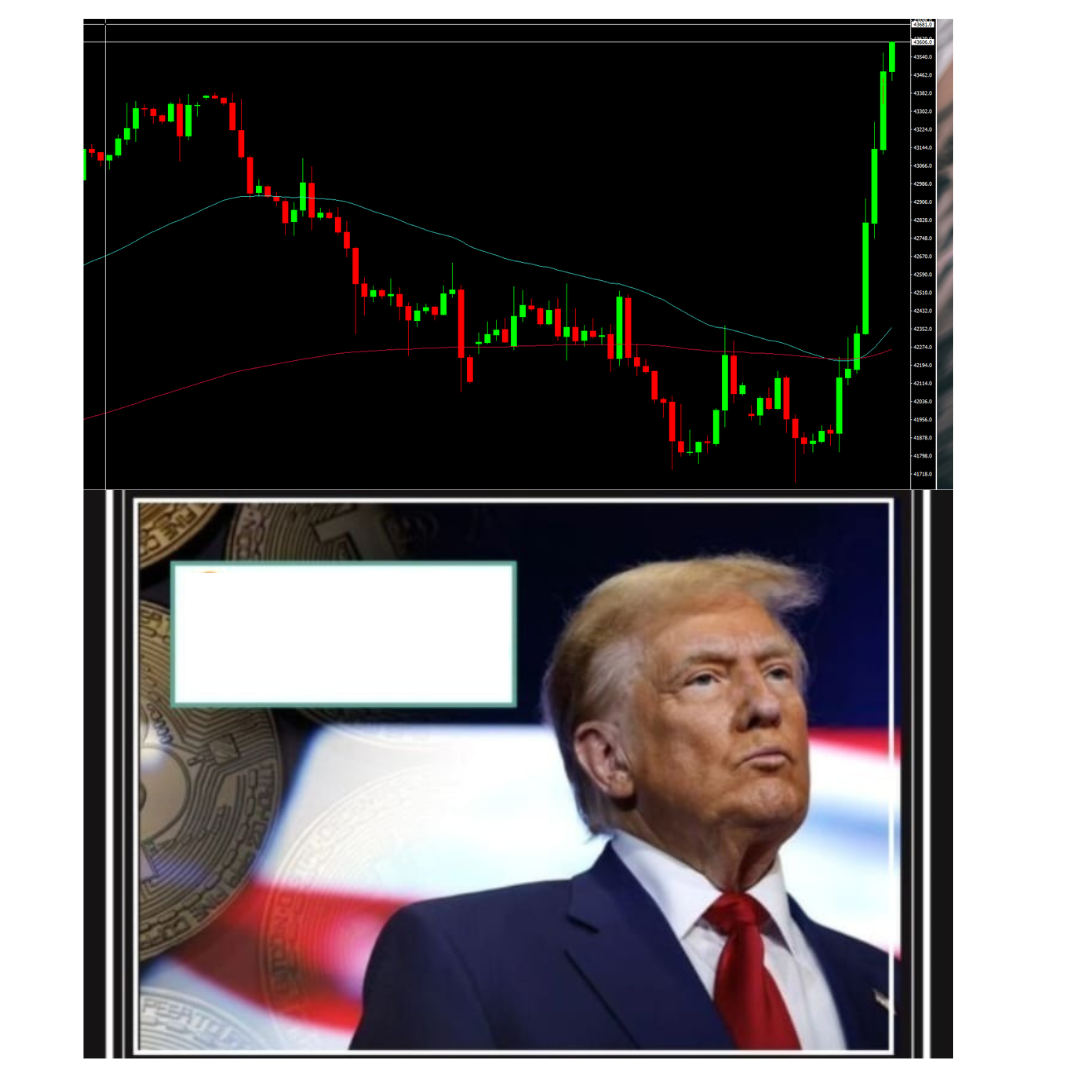
US Election Sparks Market Rally: Dow Jon...
November 06, 2024
Market Insights
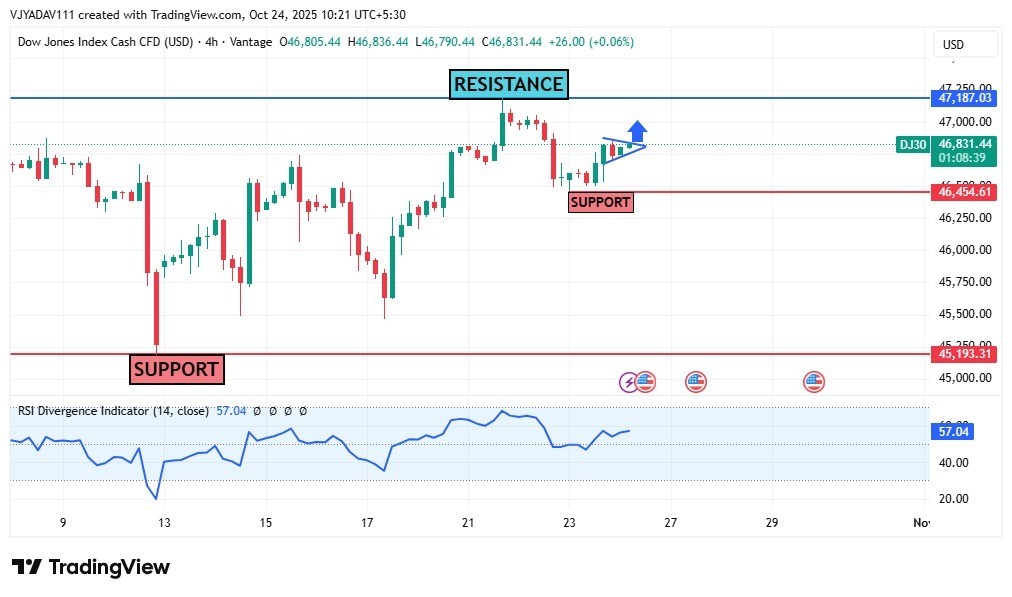
Dow Jones Poised for a Powerful Breakout...
October 24, 2025
Market Insights
Gold regained traction amid rising conce...
May 19, 2025
Market Insights
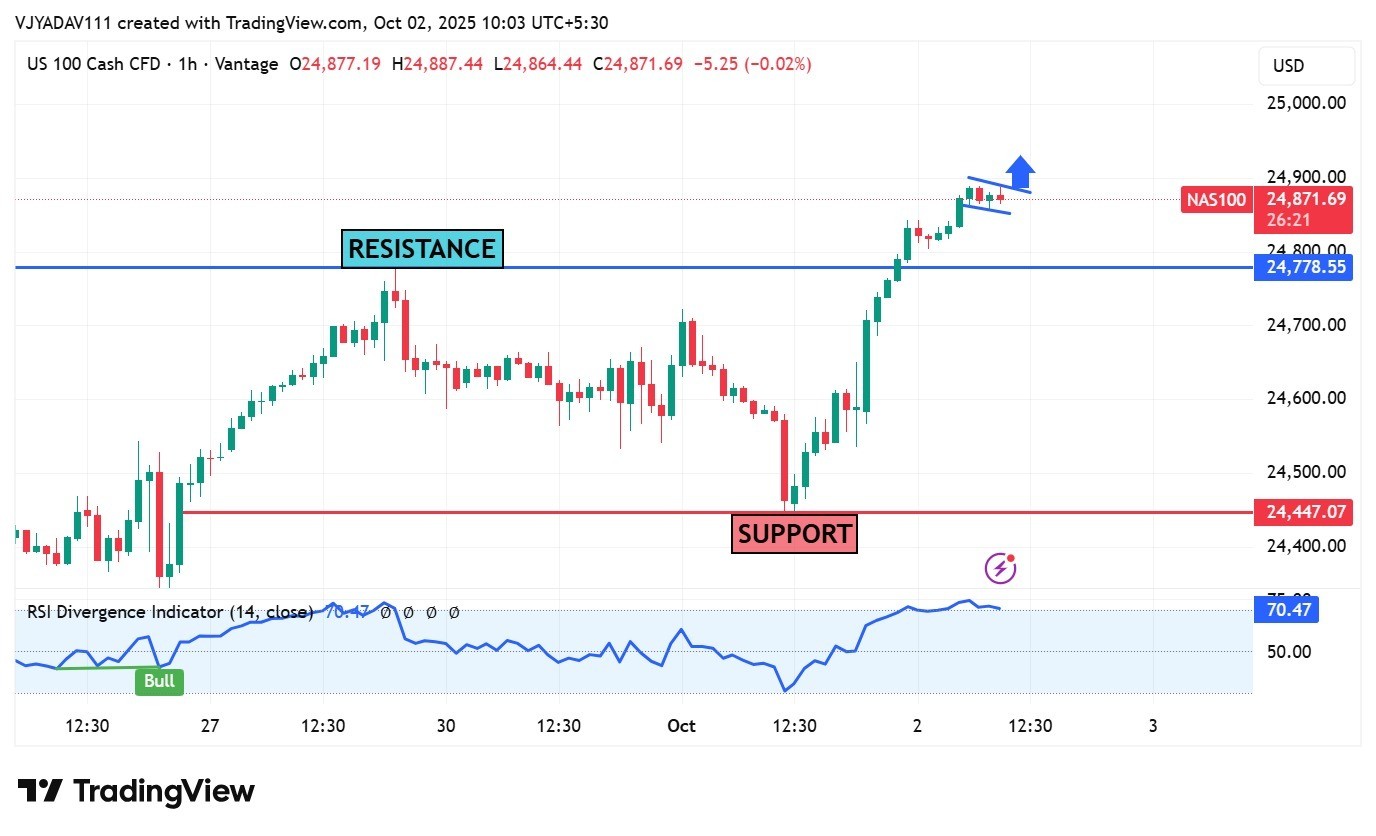
NASDAQ sustaining on ATH levels key poin...
October 02, 2025
Market Insights


