Gold may halt rally after 8 Days of Buying as Doji Appears on Daily Chart, Bond Yields crossed 200DSMA on Daily.
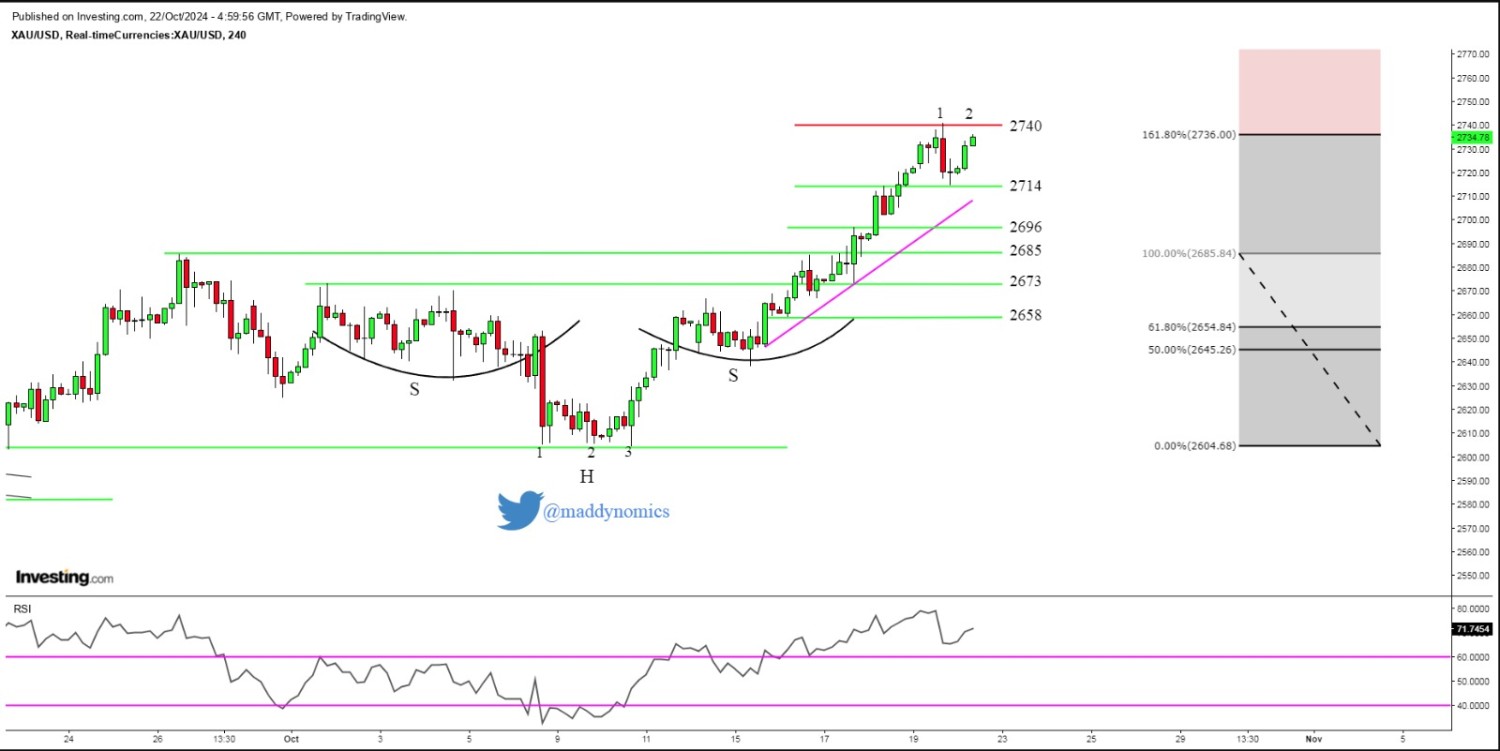
Gold Prices took some breather yesterday after touching a All Time High Levels of $2740.60. We have seen some Profit Booking from higher levels & Gold prices corrected and made a low near 2714. However, in Asian Session Buyers again took charge & at the time of writing this report Gold Prices are trading at $2733-2734 Levels.The uncertainty surrounding the US Presidential election on November 5, along with the risk of a broader Middle East conflict and the expected interest rate cuts by major central banks, continue to offer some support to the safe-haven precious metal. However, US10 Year Bond yields have crossed 200DSMA on Daily Chart and currently trading at 4.21%.
Gold Structure: Doji on Daily after 4 days of Uptrend, Possibility of Double top on 4hr.
Intraday Strategy/ Intraday Trend: Buy on Support/ Sell on Resistance, Mild Weak below 2714, Strong above 2740/ Neutral
Weekly Trend: Hyper Bullish
Major Resistance: 2740,Undefined, Undefined
Major Support: 2728,2721,2714
Recent News
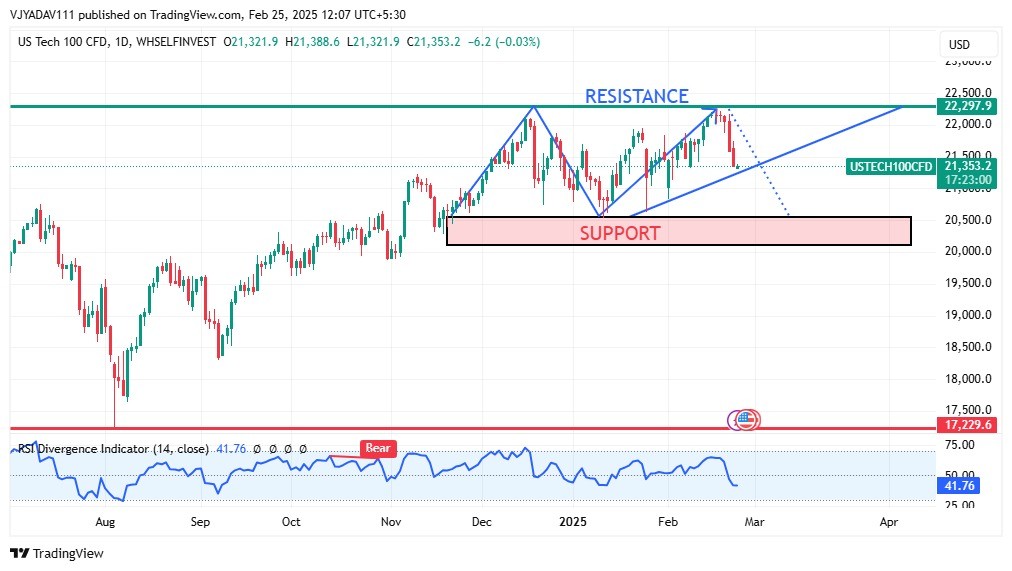
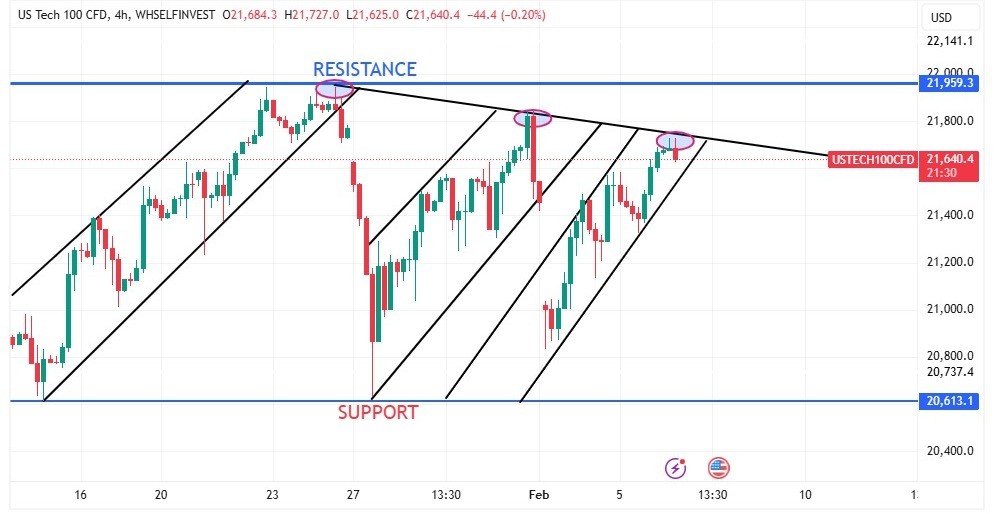
US Tech 100 Tests Key Support Zone Amid...
February 25, 2025
Market Insights

Forex Today: US CPI inflation data and F...
November 13, 2024
Market Insights
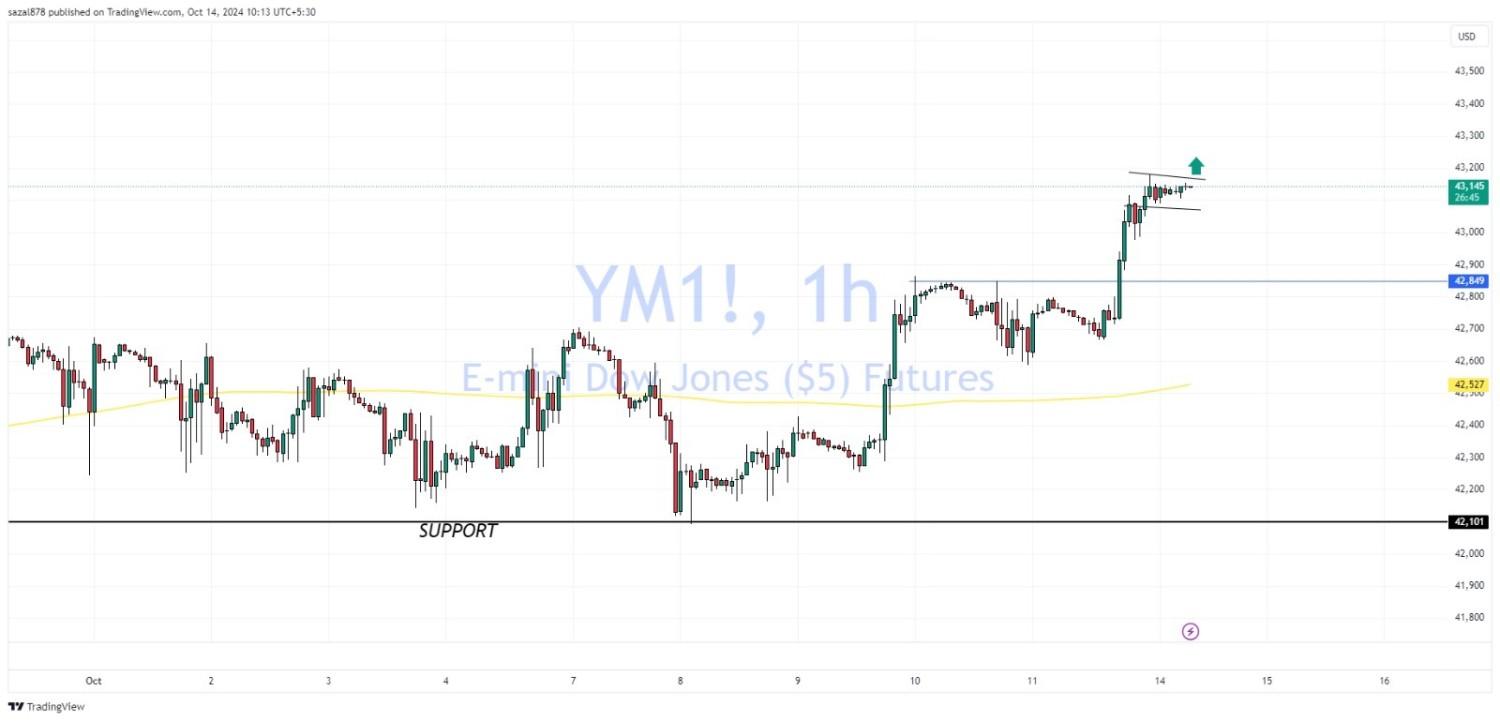
Dow Jones Analysis
October 14, 2024
Market Insights
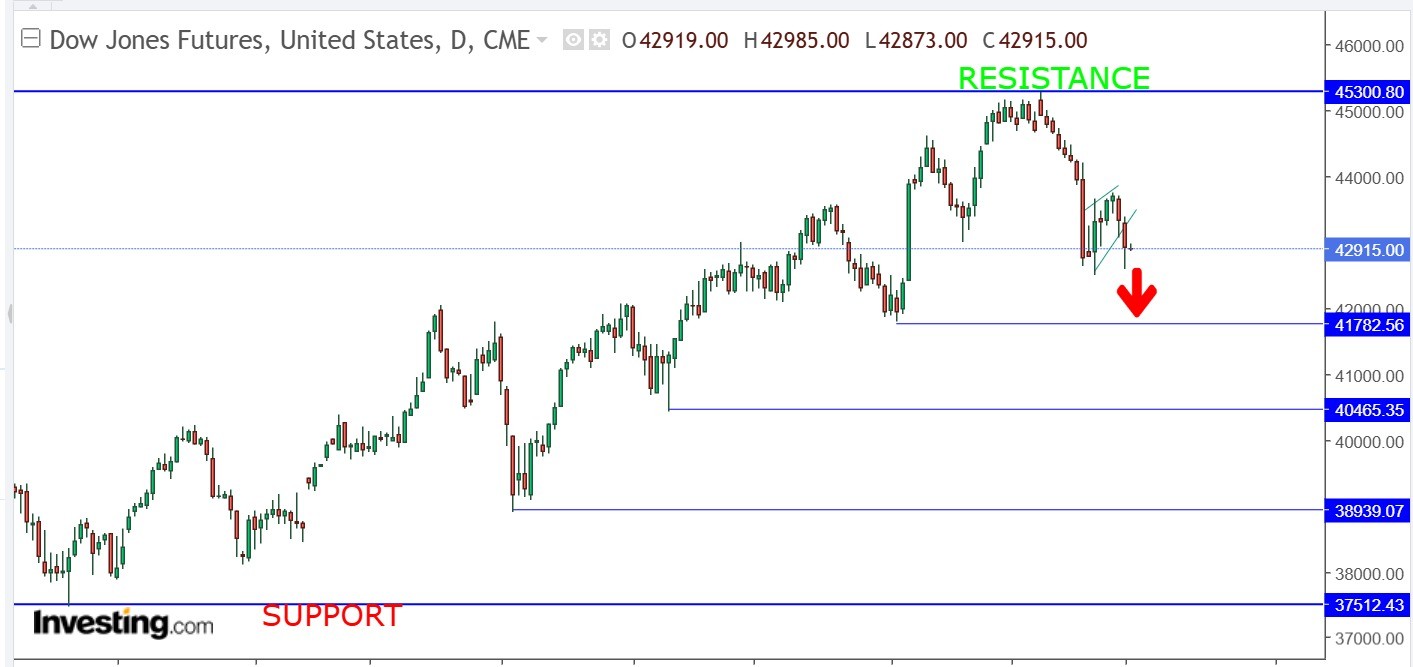
DOW JONES bounce from daily support zone
December 31, 2024
Market Insights
NASDAQ trading on 4HR TL
February 06, 2025
Market Insights
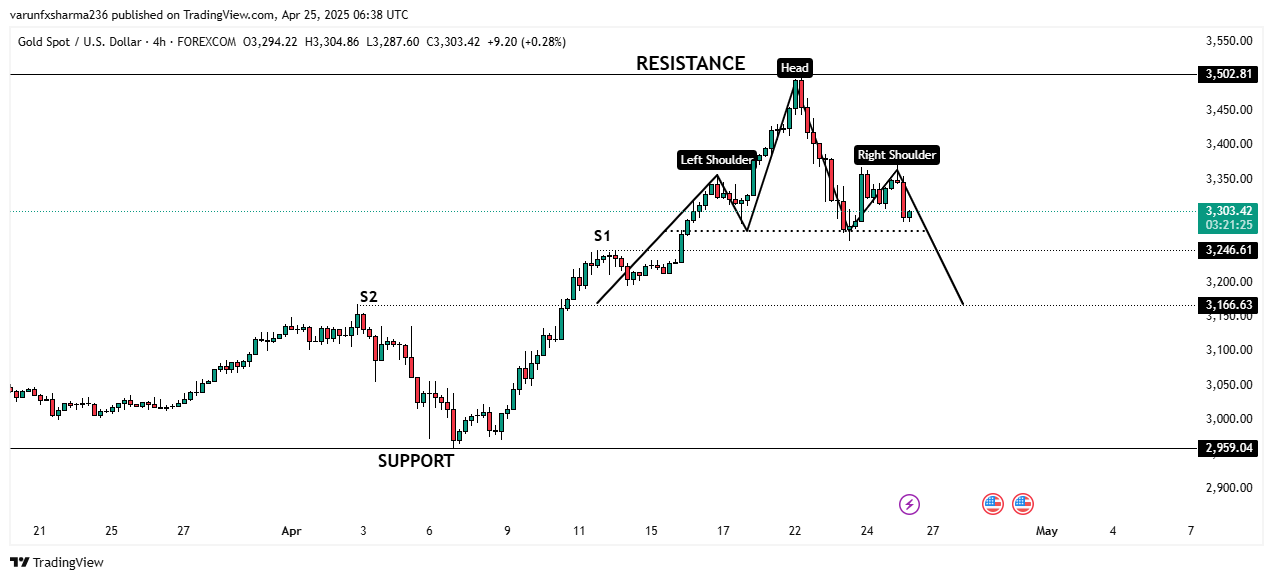
Gold Stumbles as Trade Tensions Ease: He...
April 25, 2025
Market Insights


