Gold hovers near 1-month high: eyes on Ascending Triangle Breakout
Gold surged past the $3,400 mark on Tuesday, hitting fresh five-week highs as a weakening US Dollar and falling Treasury yields supported the precious metal. The sharp rebound was driven by a broad sell-off in the Greenback, with the US Dollar Index dropping to two-week lows. Softer US yields across the curve and persistent global trade concerns further bolstered gold’s safe-haven appeal.
Investor sentiment was also influenced by political tensions, as President Trump intensified criticism of Fed Chair Powell, fueling speculation over central bank leadership. Meanwhile, the focus now shifts to upcoming US and global economic activity data and labor market reports, which could guide gold's next move.
XAU/USD TECHNICAL OVERVIEW
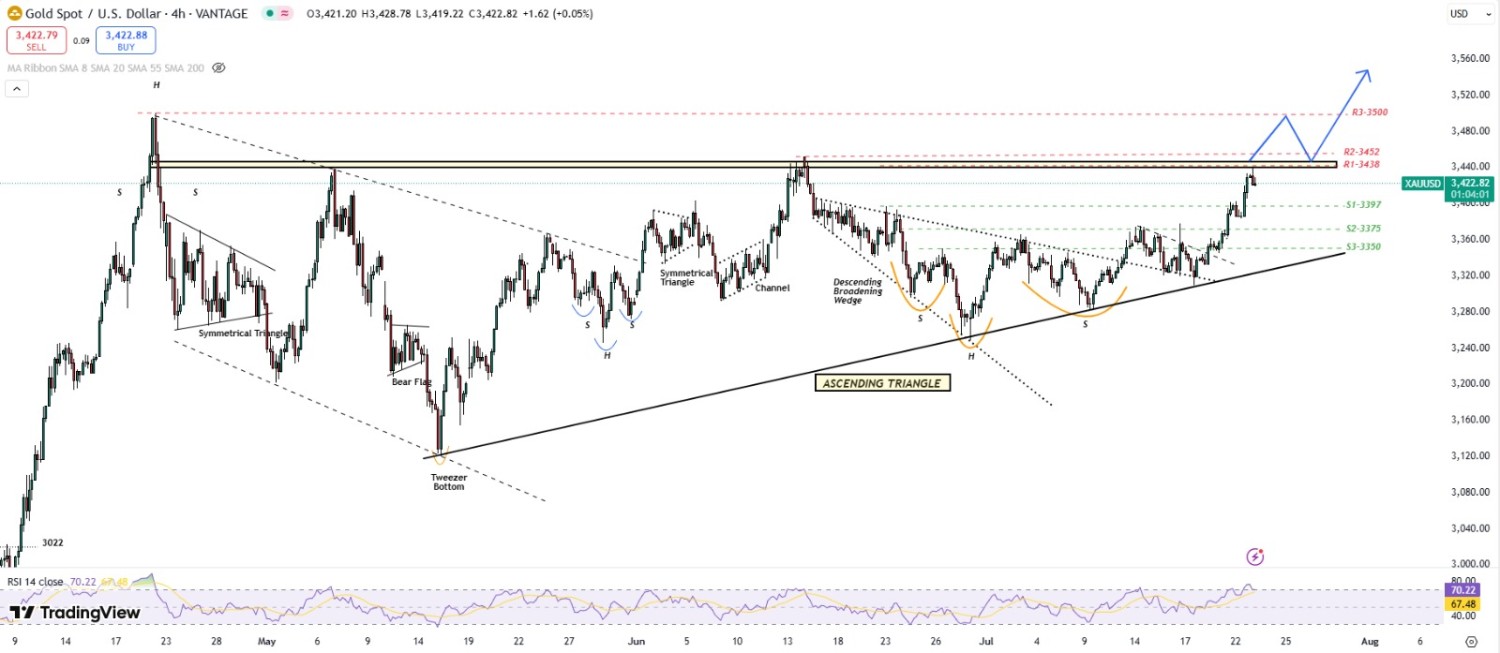
Technical Structure: Gold maintains a bullish technical structure, forming an Ascending Triangle pattern on the Daily chart, a continuation signal that suggests buyers are building momentum. Price is also trading above the 20-day SMA, reinforcing the medium-term upward bias. On the 4-hour chart, a Doji candle signals short-term indecision, while the 1-hour chart shows a Bearish flag, indicating potential minor consolidation before continuation.
Weekly Trend: Uptrend
Intraday Trend/ Intraday Strategy: The intraday bias remains bullish and suggests buying on breakouts and buying at support level.
Major Support: 3409, 3397, 3375
Major Resistance: 3438, 3452, 3470
Recent News
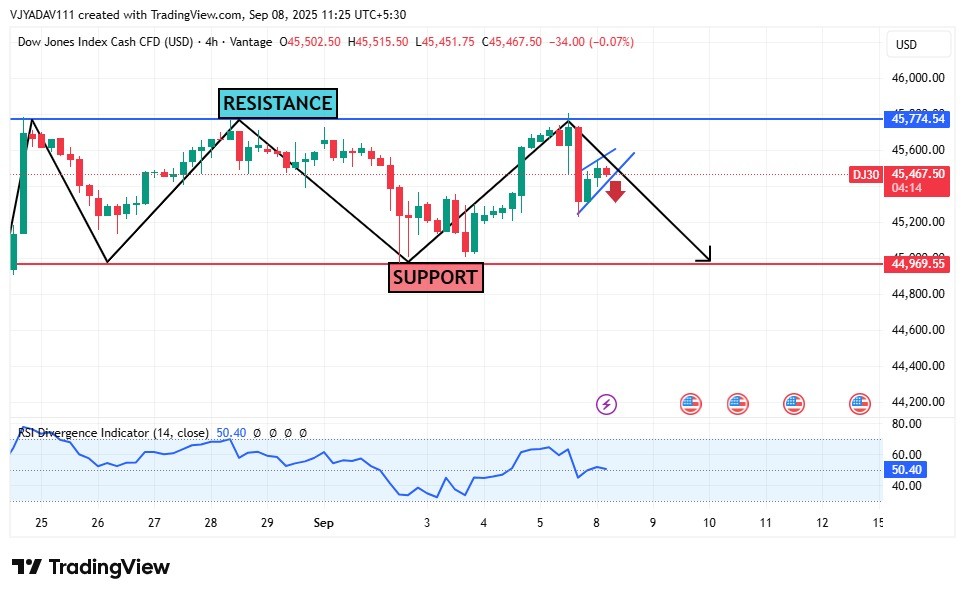
Dow Jones Faces Rejection at Resistance,...
September 08, 2025
Market Insights
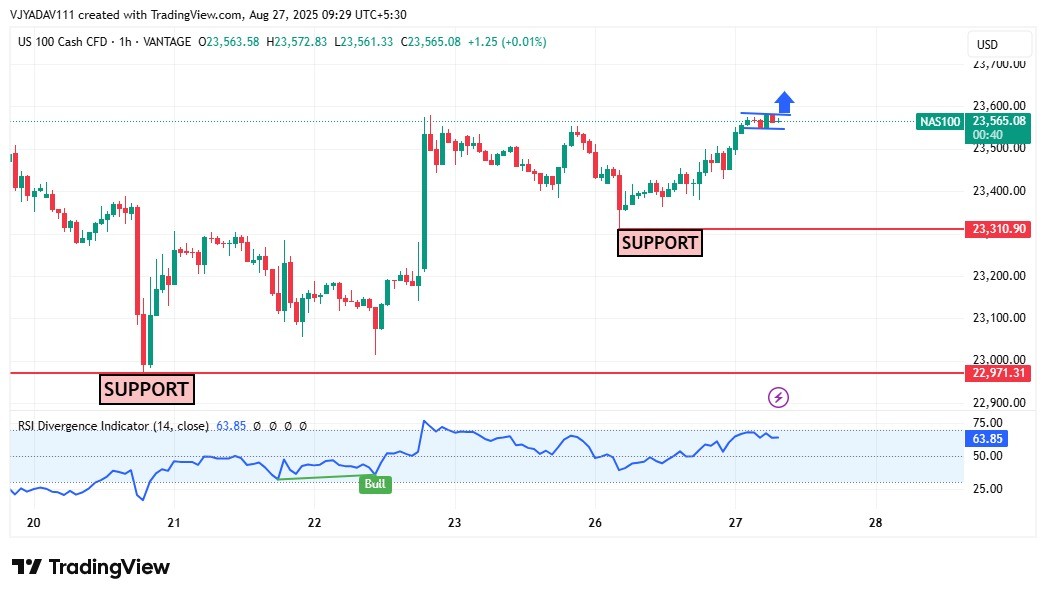
Nasdaq 100 Holds Above Support at 23,310...
August 27, 2025
Market Insights
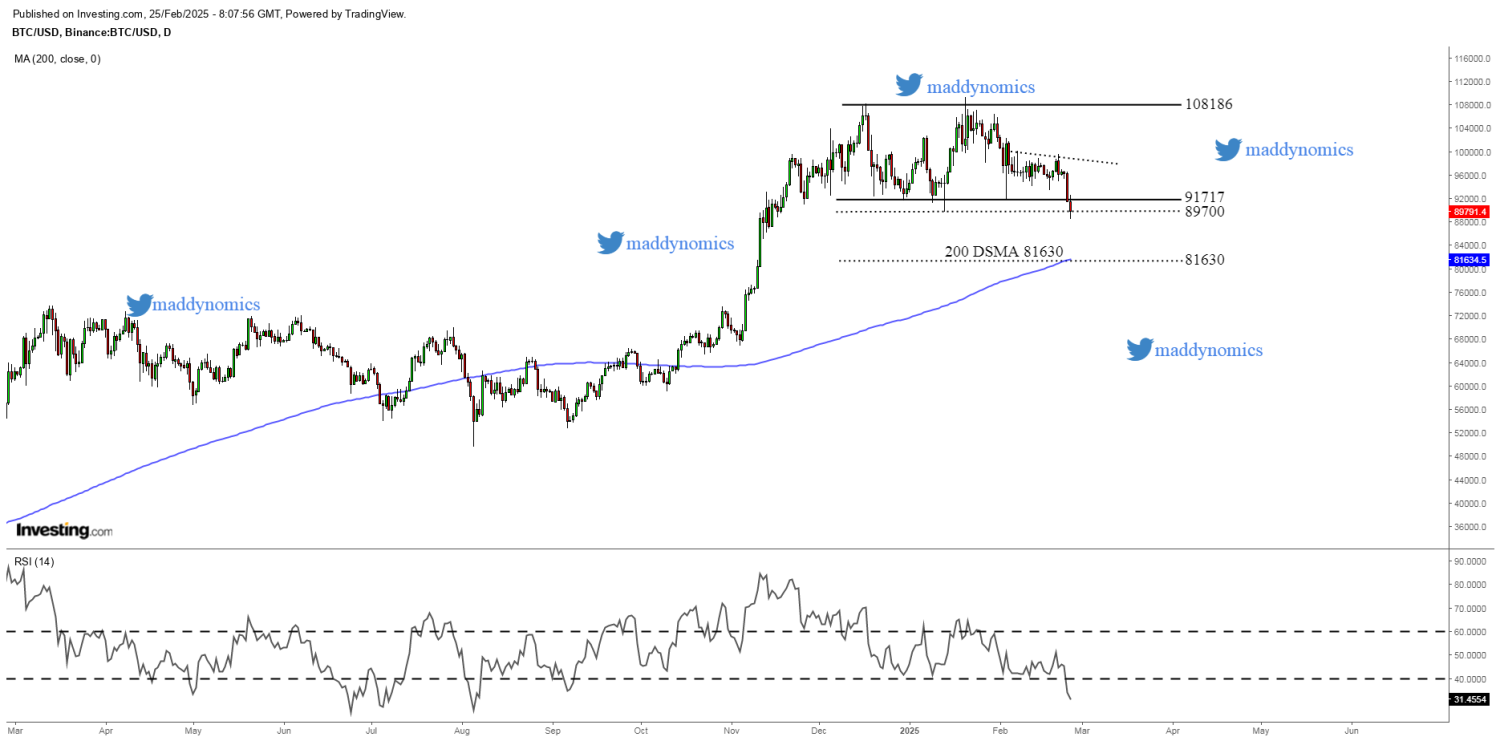
Bitcoin down 3% & breaks 90,000$ level a...
February 25, 2025
Market Insights

Oil Prices Climb for Second Day Amid Fre...
February 25, 2025
Market Insights

AUDJPY Bullish Reversal Pattern: Head &...
March 10, 2025
Market Insights
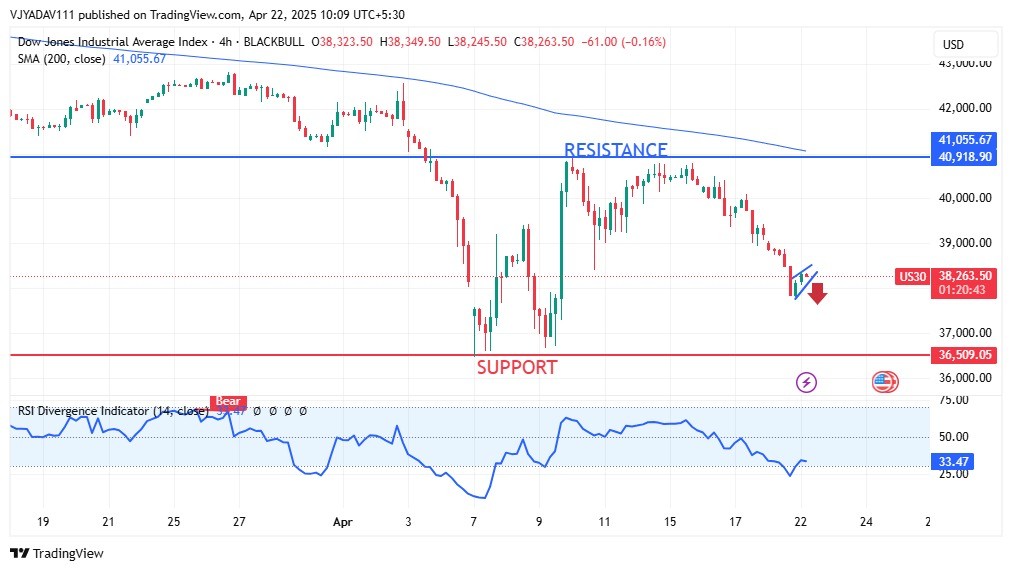
DOW JONES making a bearish flag in 4hr t...
April 22, 2025
Market Insights


