Gold holds at Ascending Triangle Support after false breakdown near $3,340
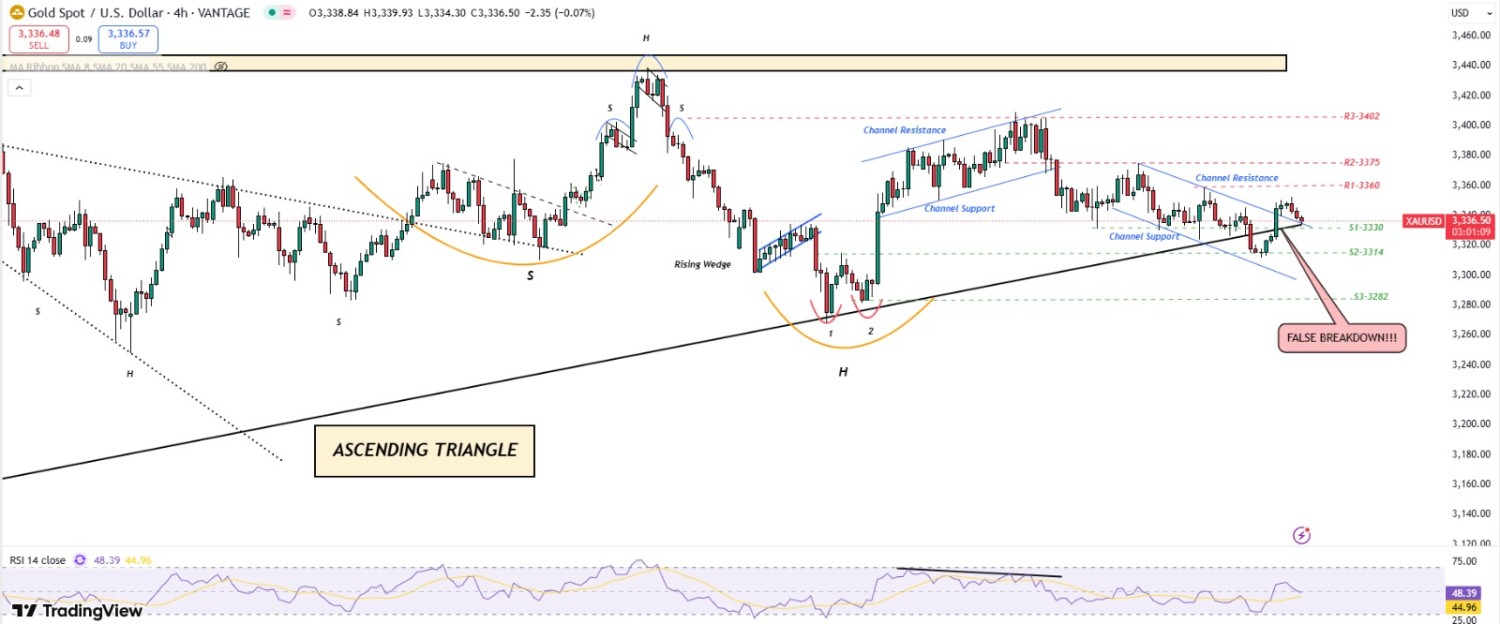
Gold dropped to a fresh three-week low of $3,311.58/oz during Asian hours after earlier rebounding to $3,340. Selling pressure stemmed from a stronger USD, though softer US yields provided some cushion. Technically, the metal staged a false breakdown of ascending triangle support but is now trading back at that level, keeping short-term sentiment mixed.
Markets now shift focus to the FOMC minutes and the Jackson Hole Symposium, with investors seeking clarity on future rate cuts and the dissenting votes from Fed officials Bowman and Waller. Upcoming flash PMI data will also be key in shaping expectations for US economic momentum and Fed policy outlook.
XAU/USD TECHNICAL OVERVIEW
Technical Structure: Gold is showing a constructive technical structure, supported by multiple bullish signals. On the daily chart, a Bullish Engulfing pattern has formed, with prices holding above the 20-SMA, reinforcing upward momentum. The 4H chart confirms a channel breakout, while the 1H chart reflects ongoing consolidation, suggesting a buildup before the next directional move.
Weekly Trend: Neutral
Intraday Trend/ Intraday Strategy: The intraday outlook leans bullish, favoring a buy-on-dips and buy-on-breakout strategy
Major Support: 3330, 3314, and 3300
Major Resistance: 3347, 3360, and 3375
Recent News
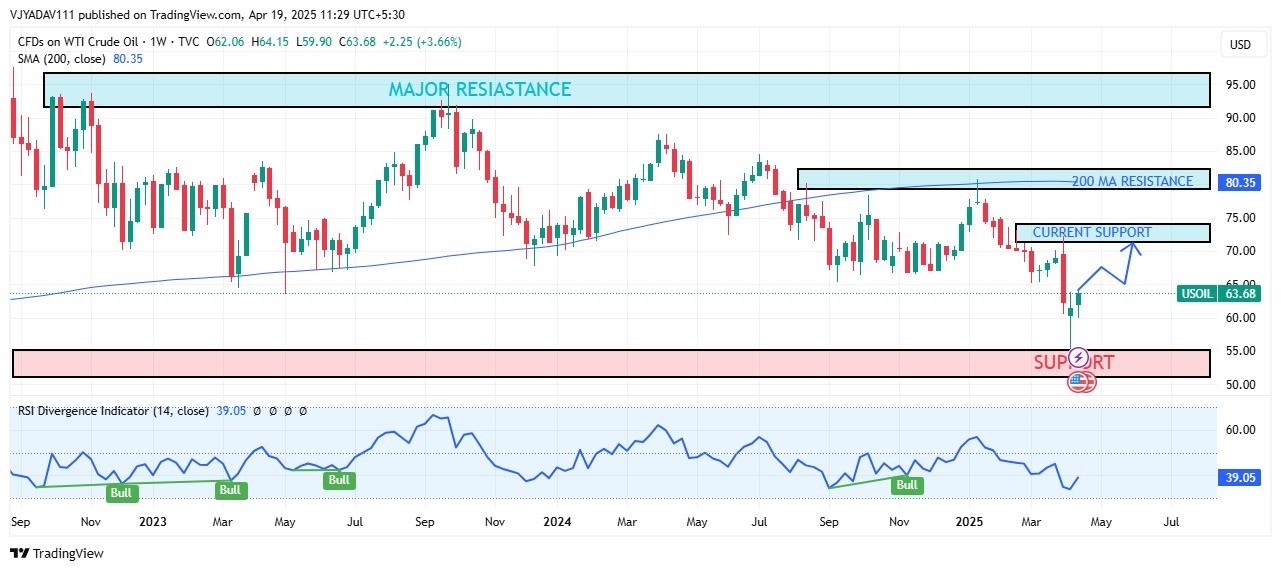
Crude Oil Surges from Major Support Leve...
April 19, 2025
Market Insights
Gold dips as Iran-Israel ceasefire cools...
June 24, 2025
Market Insights
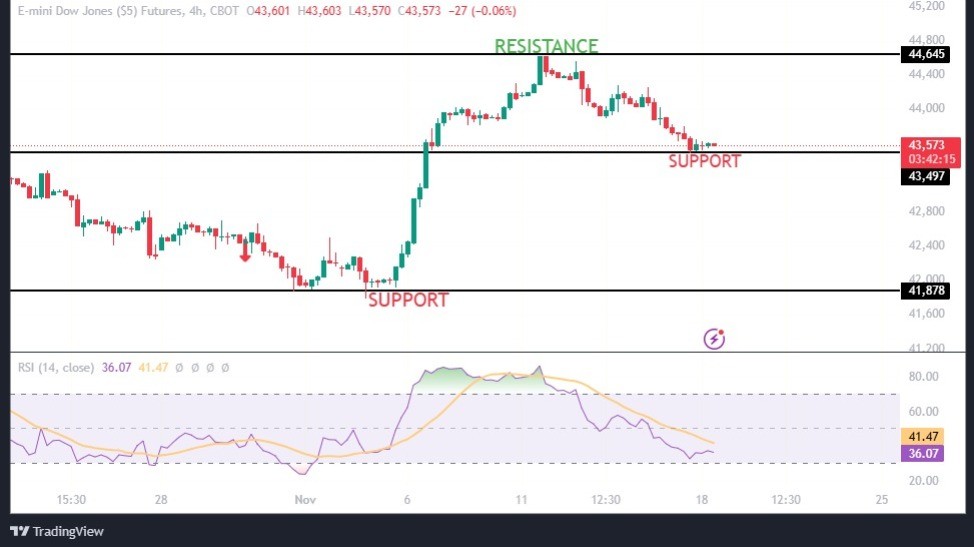
Dow Jones Industrial Average backslides...
November 18, 2024
Live Charts
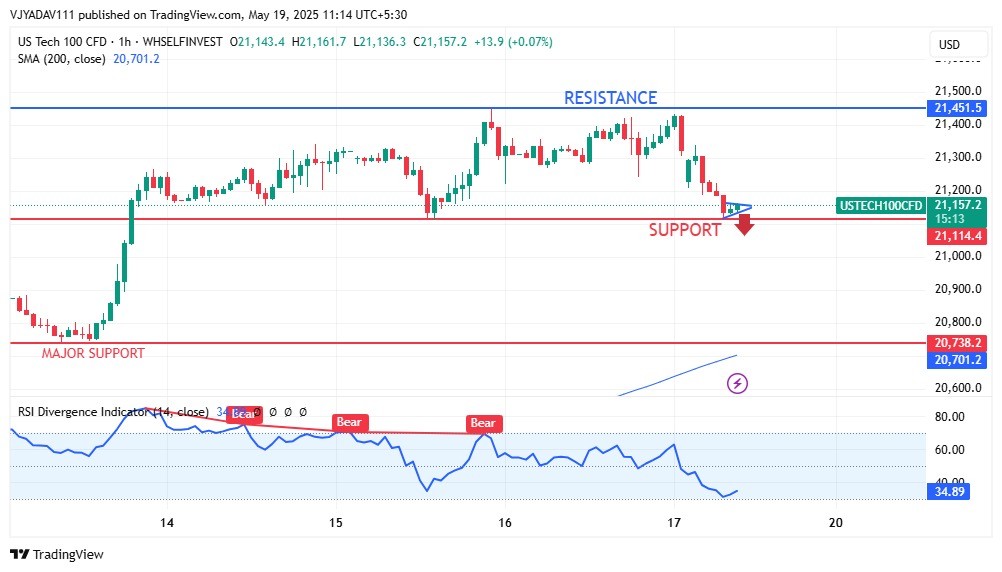
NASDAQ 100 Under Pressure Key Support Le...
May 19, 2025
Market Insights
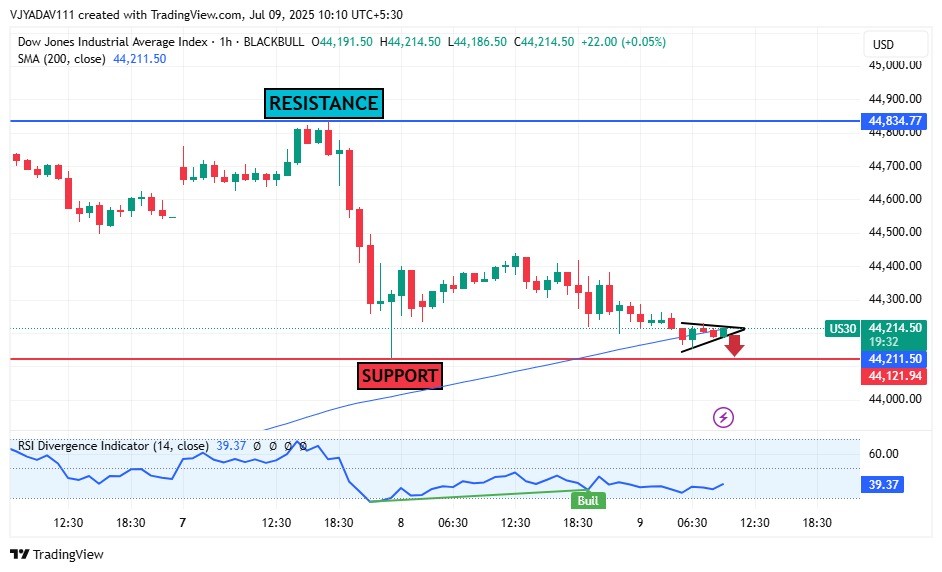
Dow Jones (US30) Struggles Below 200 SMA...
July 09, 2025
Market Insights
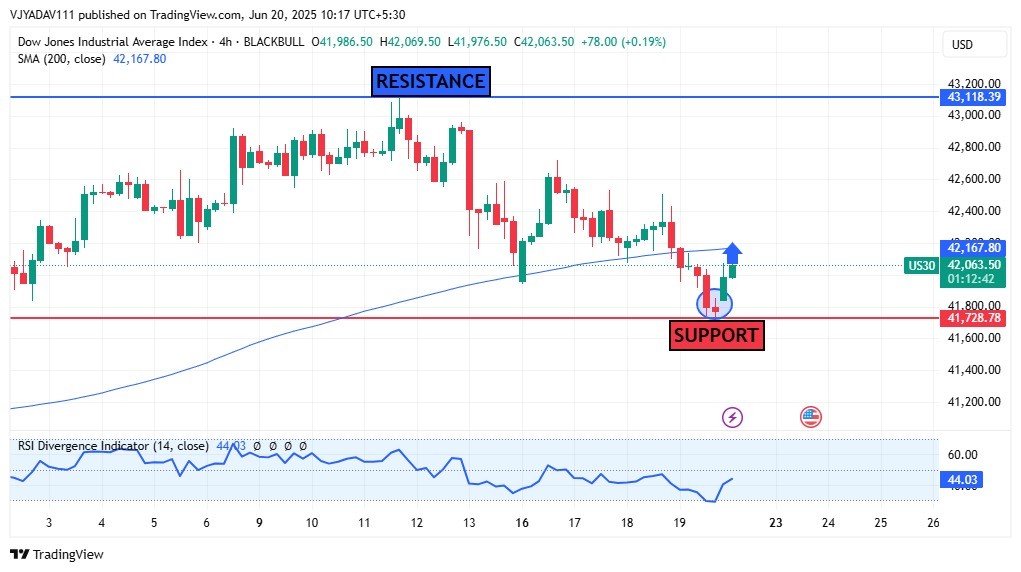
DOW JONES bounce from daily support leve...
June 20, 2025
Market Insights


