Gold gains ground on weaker Dollar and geopolitical jitters
Gold continues to trade with a positive bias near daily highs in the European session, extending its rebound from a recent two-week low around the $3,200 level. The precious metal is drawing strong safe-haven flows as investors respond to a renewed surge in geopolitical risk in the Middle East and ongoing global economic uncertainty. Over the weekend, Yemen’s Houthi rebels launched a ballistic missile that struck near Israel’s Ben Gurion Airport, a major escalation in their long-range campaign against Israel. These developments mark a significant intensification in the Middle East conflict landscape, adding to already elevated tensions from the Israel-Hamas war. The growing risk of a multi-front conflict is pushing investors toward traditional safe-haven assets like gold.
At the same time, investor sentiment is clouded by concerns over proposed tariffs from former U.S. President Donald Trump, which threaten to reignite trade tensions and weigh on global growth. Market participants now await the upcoming FOMC policy meeting starting Tuesday for clearer signals on the Fed’s monetary path. While the central bank is expected to hold steady, growing expectations for rate cuts later this year could reinforce gold’s bullish momentum.
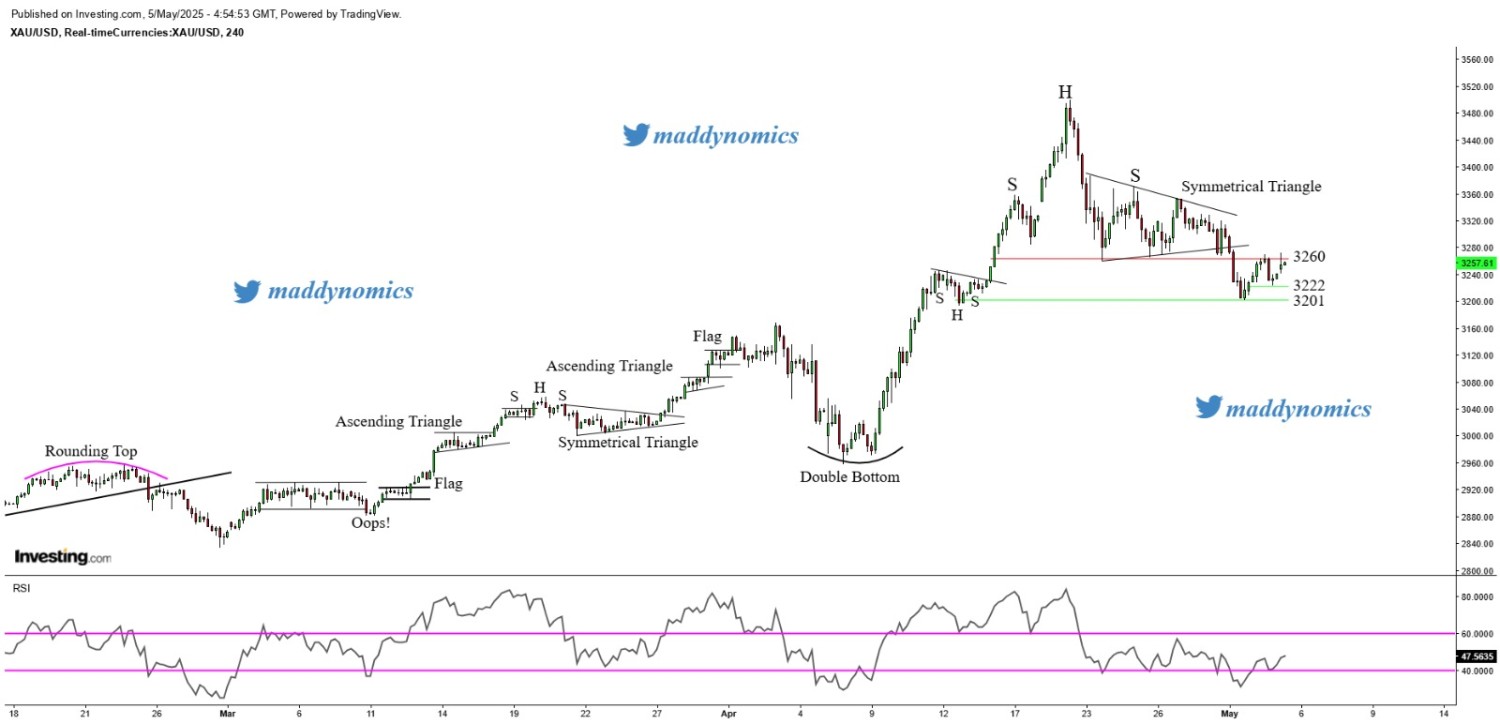
XAU/USD TECHNICAL OVERVIEW
Technical Structure: Gold has shown a breakdown of the Doji candle on the weekly chart, indicating potential weakness or indecision resolving to the downside. The daily chart prints another Doji candle, reinforcing the current indecisiveness. Price is currently hovering around the 20-Day Simple Moving Average making this a pivotal level to watch for near-term directional bias. On the 1-hour chart, an Elliott Wave ABC correction appears to be unfolding. This structure typically implies that a corrective phase is underway, and a new impulse move could follow after the C leg completes.
Weekly Trend: Neutral
Intraday Trend/ Intraday Strategy: The intraday bias remains Bullish to Neutral favouring the strategy of Buying on Supports and Selling near Resistance.
Major Resistance: 3300, 3320, 3338
-
Major Support: 3272, 3280, 3286
Recent News
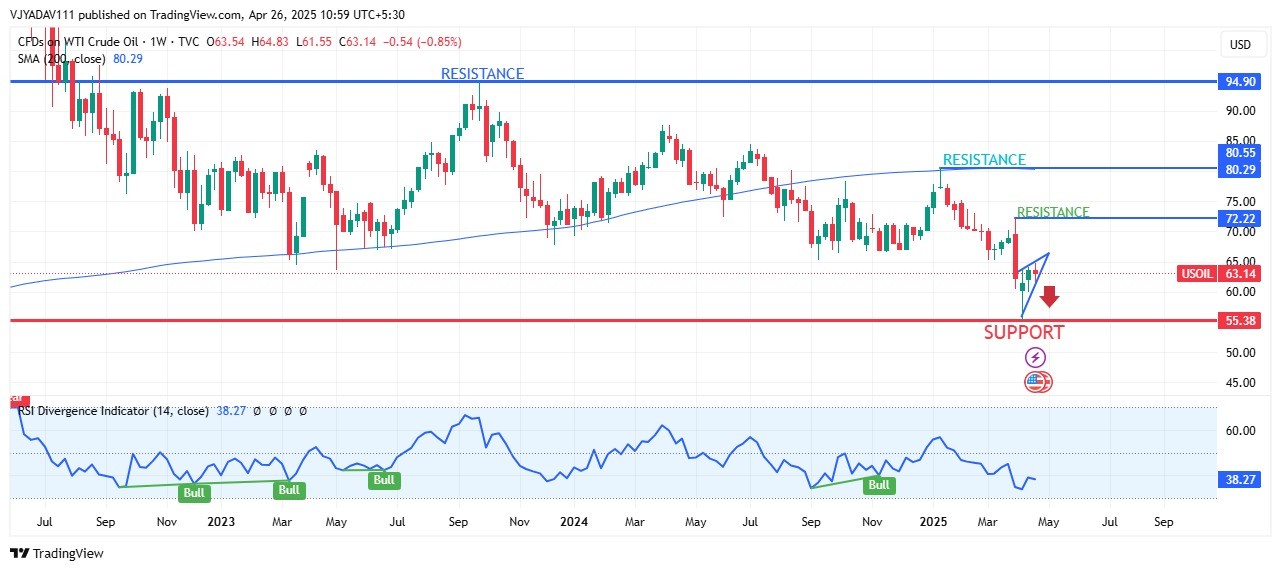
WTI CRUDE OIL AT CRITICAL LEVELS BEARISH...
April 26, 2025
Market Insights
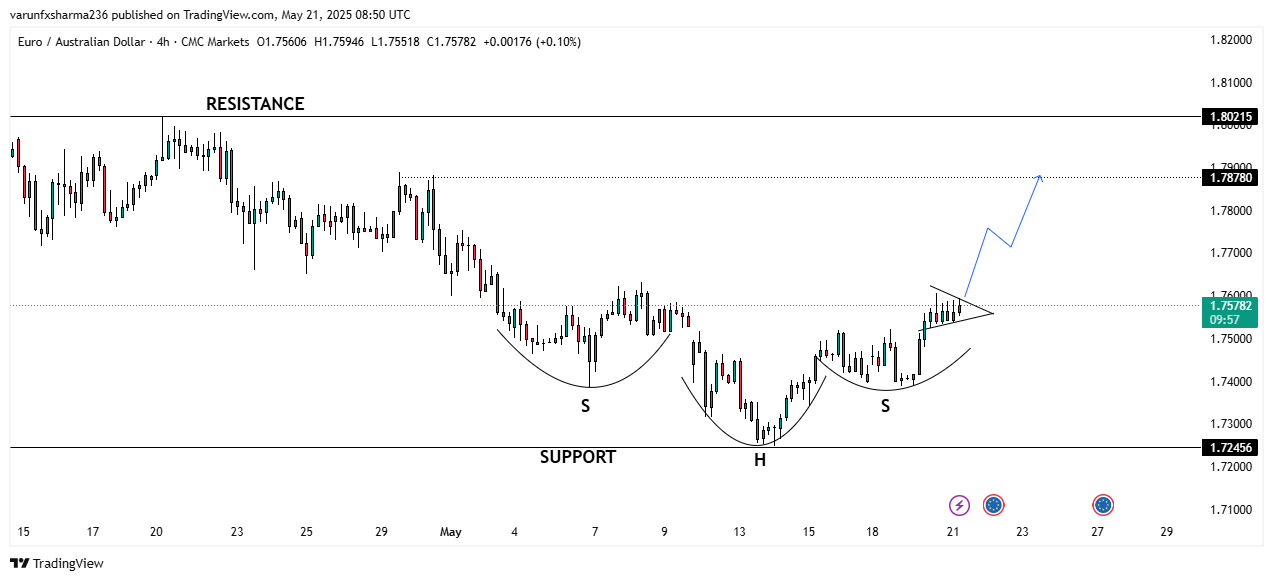
EUR/AUD – Bullish Reversal Pattern Indic...
May 21, 2025
Market Insights
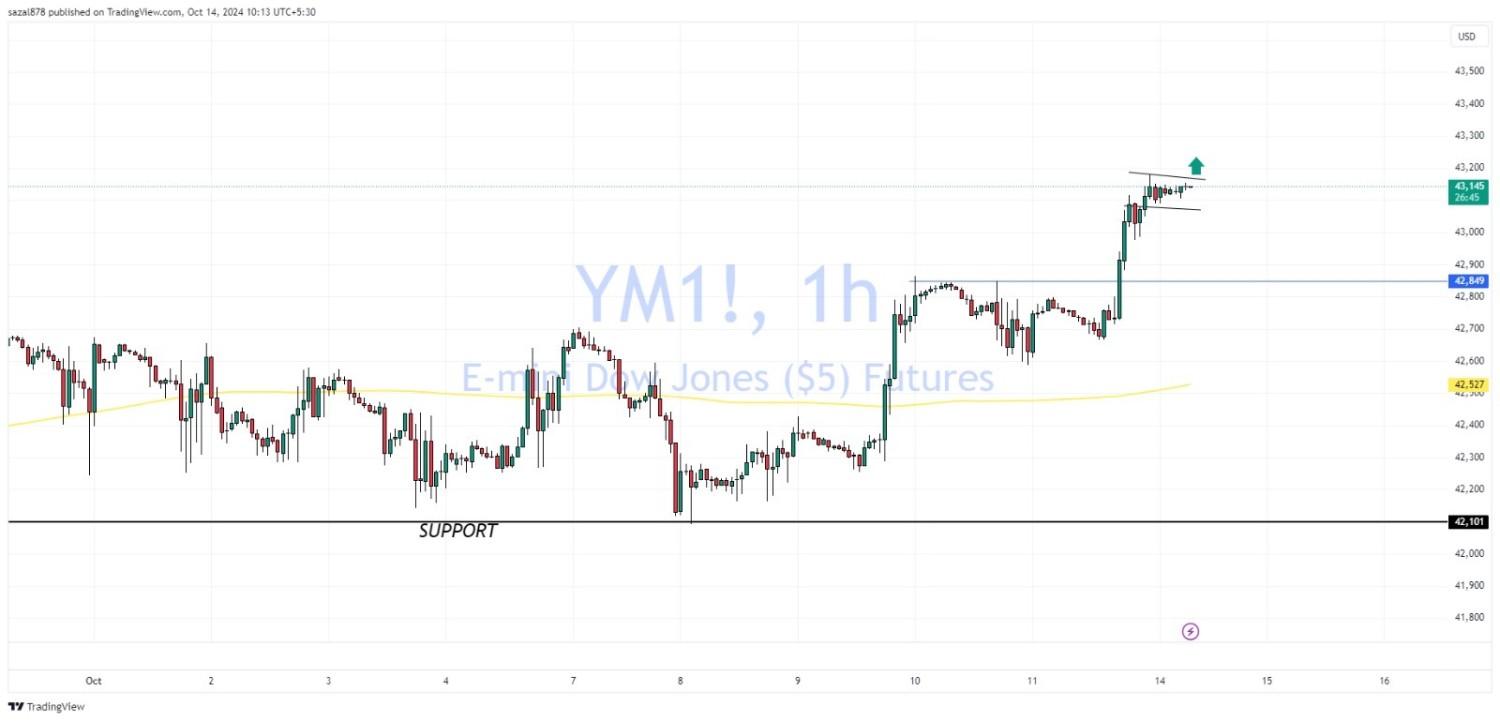
Dow Jones Analysis
October 14, 2024
Market Insights
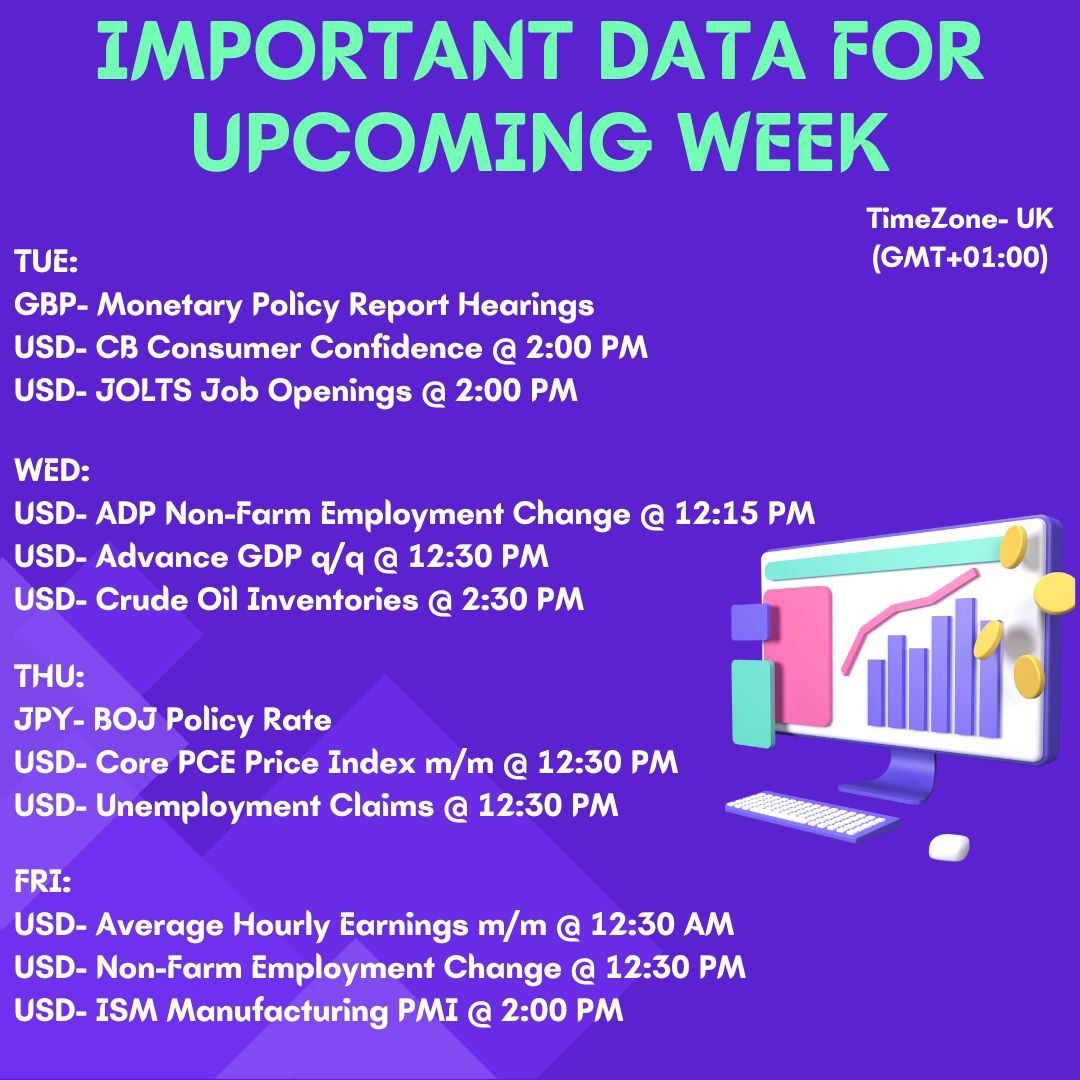
IMPORTANT DATA's FOR THIS WEEK
October 28, 2024
Market Insights

Gold analysis and News
November 18, 2024
Market Insights
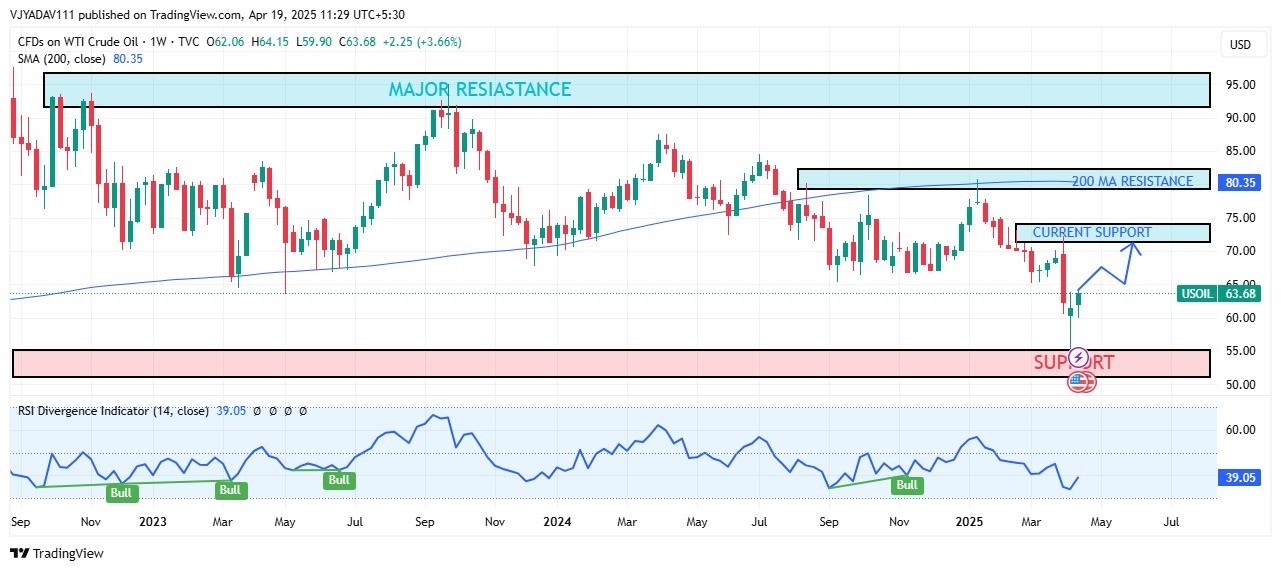
Crude Oil Surges from Major Support Leve...
April 19, 2025
Market Insights


