EUR/USD stays pressured toward 1.0800 amid fresh US Dollar demand

Immediate resistance lies at the YTD high of 1.0954 (March 18). A firm break above that level would target 1.0969 (the 23.6% Fibonacci retracement) and could pave the way for a test of the psychological 1.1000 barrier.
On the downside, the 200-day Simple Moving Average (SMA) at 1.0728 acts as initial support, followed by the provisional 100-day SMA at 1.0522 and the 55-day SMA at 1.0498. Below these levels are 1.0359 (the February 28 low), 1.0282 (the February 10 low), 1.0209 (the February 3 low), and the 2025 bottom of1.0176 (January 13).
Momentum signals remain somewhat bullish, with the Relative Strength Index (RSI) sitting around 62, and the Average Directional Index (ADX) near 32 indicating a strengthening uptrend.
Recent News
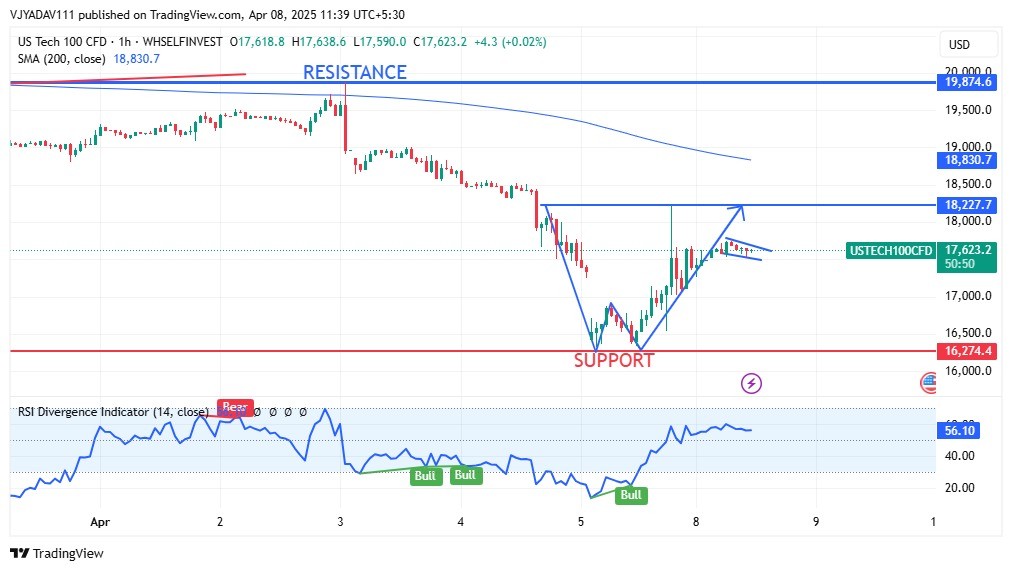
US Tech 100 Surges from Double Bottom Fo...
April 08, 2025
Market Insights
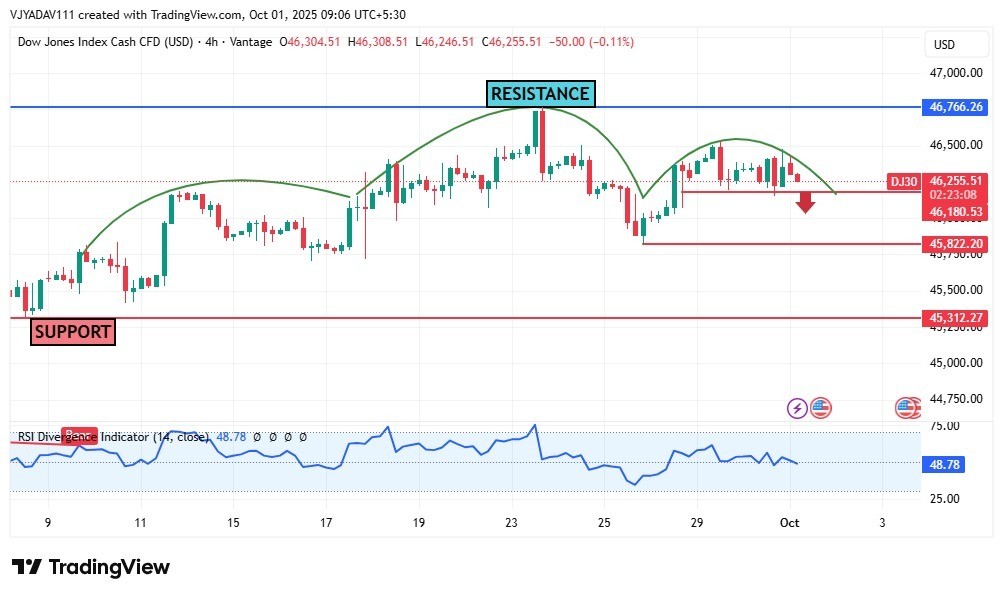
Dow Jones Forms Double-Top Pattern, Risk...
October 01, 2025
Market Insights
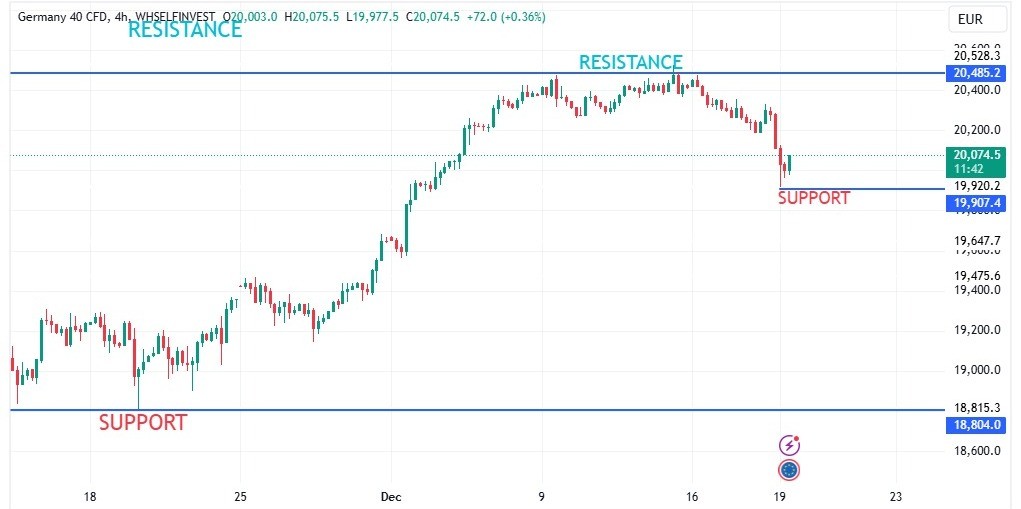
DAX sharp fall after FOMC
December 19, 2024
Market Insights
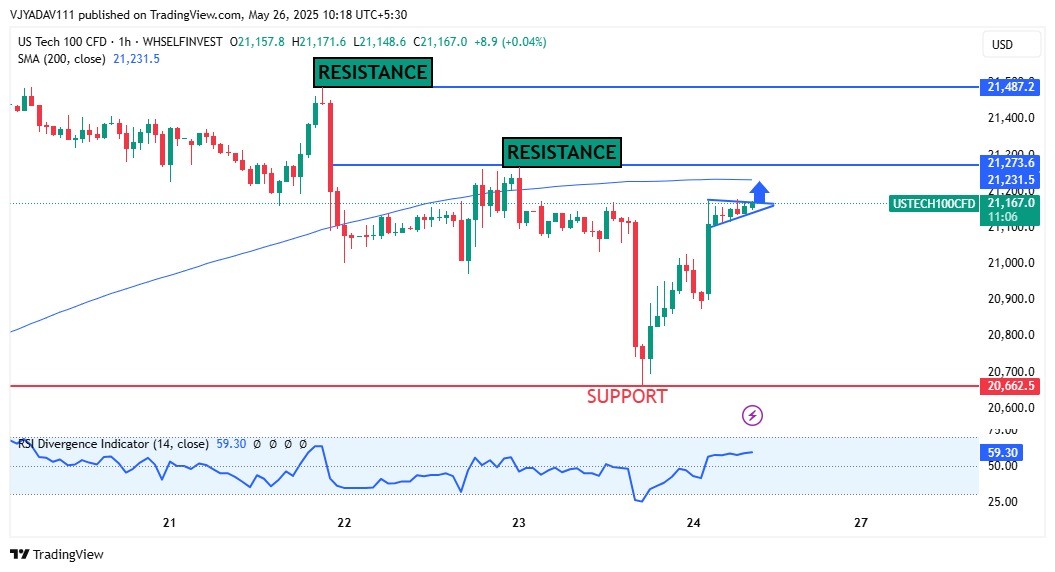
US Tech 100 Approaching Key Resistance L...
May 26, 2025
Market Insights
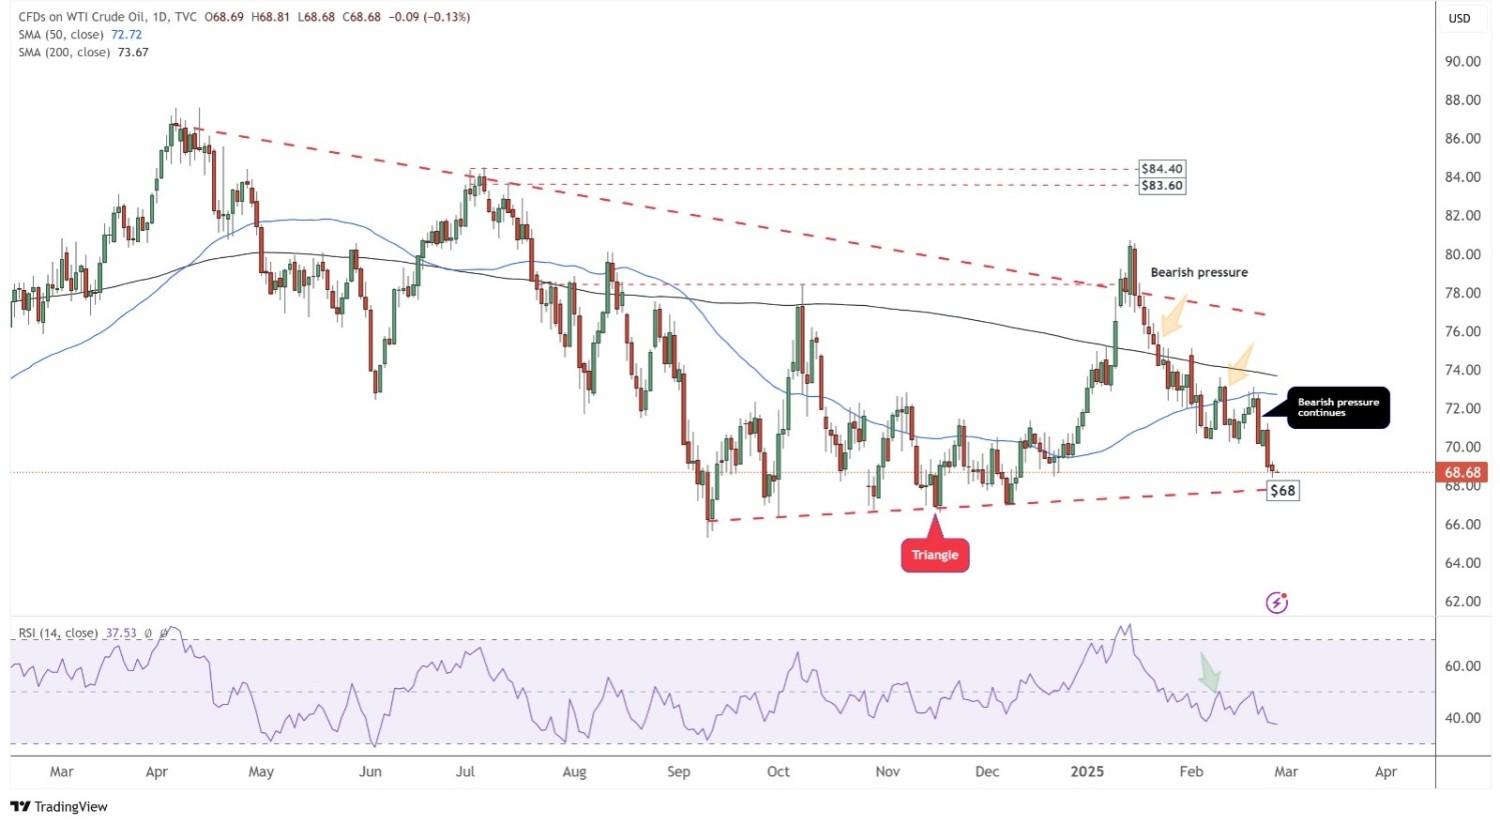
WTI Crude Oil Approaching Key $66–$68 Su...
February 27, 2025
Market Insights
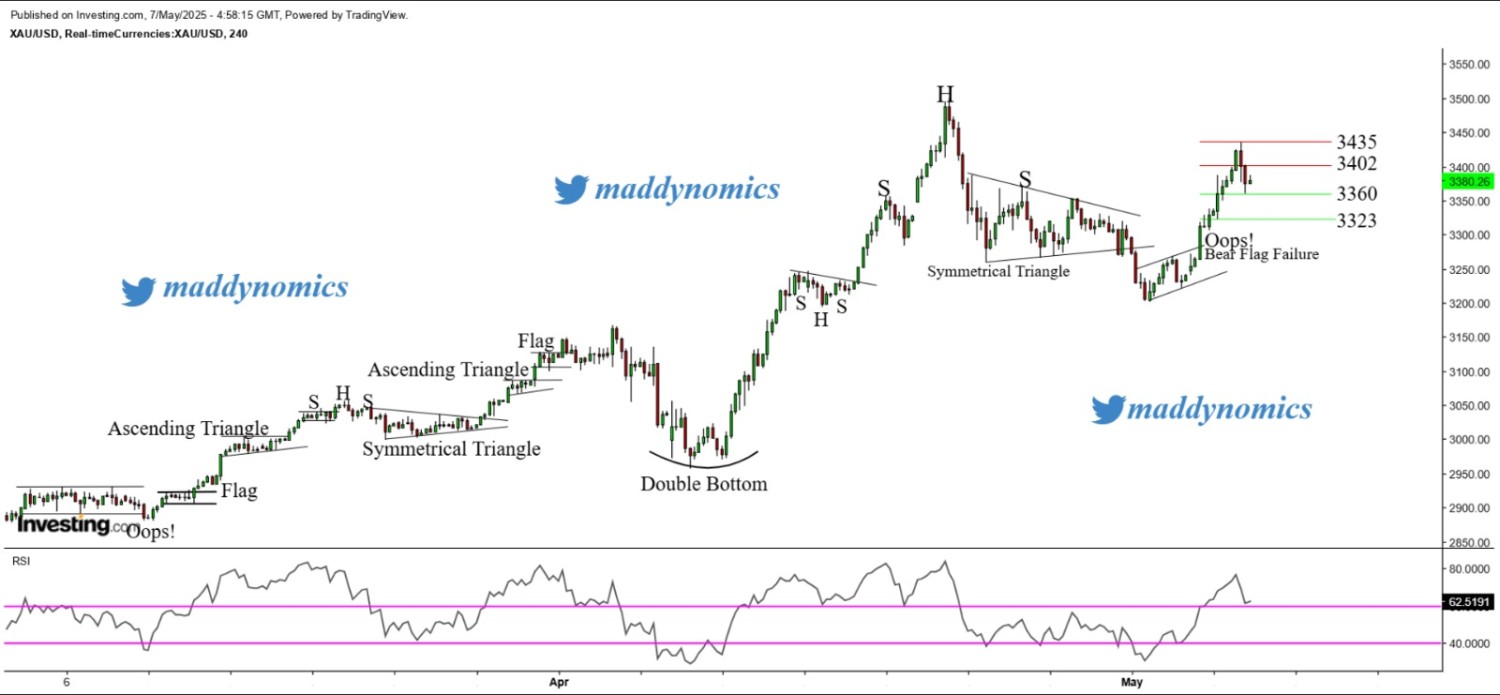
Gold erases its weekly gains ahead of FO...
May 07, 2025
Market Insights


